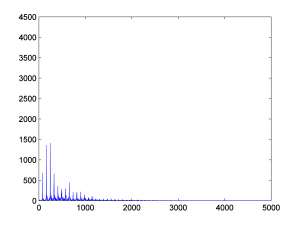
When we applied the Fourier transform in MATLAB in Section 2.3.9, we didn’t specify a window size. Thus, we were applying the FFT to the entire piece of audio. If you listen to the WAV file HornsE04Mono.wav, a three second clip, you’ll first hear some low tubas and them some higher trumpets. Our graph of the FFT shows frequency components up to and beyond 5000 Hz, which reflects the sounds in the three seconds. What if we do the FFT on just the first second (44100 samples) of this WAV file, as follows? The resulting frequency components are shown in Figure 2.49.
y = audioread('HornsE04Mono.wav');
sr = 44100;
freqs = [0:(sr/2)-1];
ybegin = y(1:44100);
fftdata2 = fft(ybegin);
fftdata2 = fftdata2(1:22050);
plot(freqs, abs(fftdata2));
axis([0 5000 0 4500]);

What we’ve done is focus on one short window of time in applying the FFT. An FFT window is a contiguous segment of audio samples on which the transform is applied. If you consider the nature of sound and music, you’ll understand why applying the transform to relatively small windows makes sense. In many of our examples in this book, we generate segments of sound that consist of one or more frequency components that do not change over time, like a single pitch note or a single chord being played without change. These sounds are good for experimenting with the mathematics of digital audio, but they aren’t representative of the music or sounds in our environment, in which the frequencies change constantly. The WAV file HornsE04Mono.wav serves as a good example. The clip is only three seconds long, but the first second is very different in frequencies (the pitches of tubas) from the last two seconds (the pitches of trumpets). When we do the FFT on the entire three seconds, we get a kind of “blurred” view of the frequency components, because the music actually changes over the three second period. It makes more sense to look at small segments of time. This is the purpose of the FFT window.
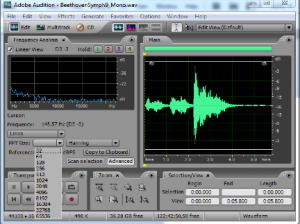
Figure 2.50 shows an example of how FFT window sizes are used in audio processing programs. Notice the drop down menu, which gives you a choice of FFT sizes ranging from 32 to 65536 samples. The FFT window size is typically a power of 2. If your sampling rate is 44,100 samples per second, then a window size of 32 samples is about 0.0007 s, and a window size of 65536 is about 1.486 s.
There’s a tradeoff in the choice of window size. A small window focuses on the frequencies present in the sound over a short period of time. However, as mentioned earlier, the number of frequency components yielded by an FFT of size N is N/2. Thus, for a window size of, say, 128, only 64 frequency bands are output, these bands spread over the frequencies from 0 Hz to sr/2 Hz where sr is the sampling rate. (See Chapter 5.) For a window size of 65536, 37768 frequency bands are output, which seems like a good thing, except that with the large window size, the FFT is not isolating a short moment of time. A window size of around 2048 usually gives good results. If you set the size to 2048 and play the piece of music loaded into Audition, you’ll see the frequencies in the frequency analysis view bounce up and down, reflecting the changing frequencies in the music as time pass.
