5.1.2.1 Two Steps: Sampling and Quantization
In the realm of sound, the digitization process takes an analog occurrence of sound, records it as a sequence of discrete events, and encodes it in the binary language of computers. Digitization involves two main steps, sampling and quantization.
Sampling is a matter of measuring air pressure amplitude at equally-spaced moments in time, where each measurement constitutes a sample. The number of samples taken per second (samples/s) is the sampling rate. Units of samples/s are also referred to as Hertz (Hz). (Recall that Hertz is also used to mean cycles/s with regard to a frequency component of sound. Hertz is an overloaded term, having different meanings depending on where it is used, but the context makes the meaning clear.)
[aside]It’s possible to use real numbers instead of integers to represent sample values in the computer, but that doesn’t get rid of the basic problem of quantization. Although a wide range of samples values can be represented with real numbers, there is still only a finite number of them, so rounding is still be necessary with real numbers.[/aside]
Quantization is a matter of representing the amplitude of individual samples as integers expressed in binary. The fact that integers are used forces the samples to be measured in a finite number of discrete levels. The range of the integers possible is determined by the bit depth, the number of bits used per sample. A sample’s amplitude must be rounded to the nearest of the allowable discrete levels, which introduces error in the digitization process.
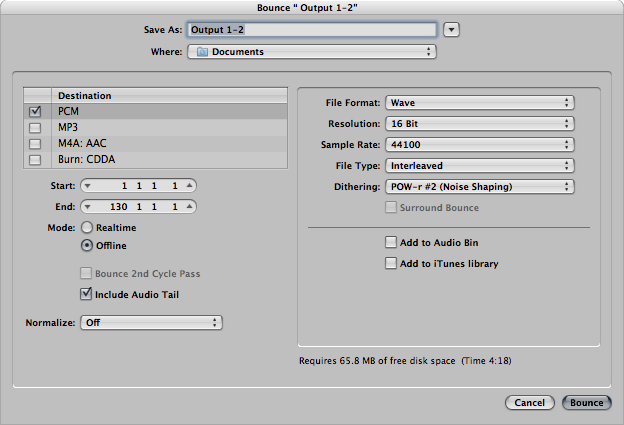
When sound is recorded in digital format, a sampling rate and a bit depth are specified. Often there are default audio settings in your computing environment, or you may be prompted for initial settings, as shown in Figure 5.3. The number of channels must also be specified – mono for one channel and stereo for two. (More channels are possible in the final production, e.g., 5.1 surround.)

A common default setting is designated CD quality audio, with a sampling rate of 44,100 Hz, a bit depth of 16 bits (i.e., two bytes) per channel, with two channels. Sampling rate and bit depth has an impact on the quality of a recording. To understand how this works, let’s look at sampling and quantization more closely.
5.1.2.2 Sampling and Aliasing
[wpfilebase tag=file id=116 tpl=supplement /]
Recall from Chapter 2 that the continuously changing air pressure of a single-frequency sound can be represented by a sine function, as shown in Figure 5.4. One cycle of the sine wave represents one cycle of compression and rarefaction of the sound wave. In digitization, a microphone detects changes in air pressure, sends corresponding voltage changes down a wire to an ADC, and the ADC regularly samples the values. The physical process of measuring the changing air pressure amplitude over time can be modeled by the mathematical process of evaluating a sine function at particular points across the horizontal axis.
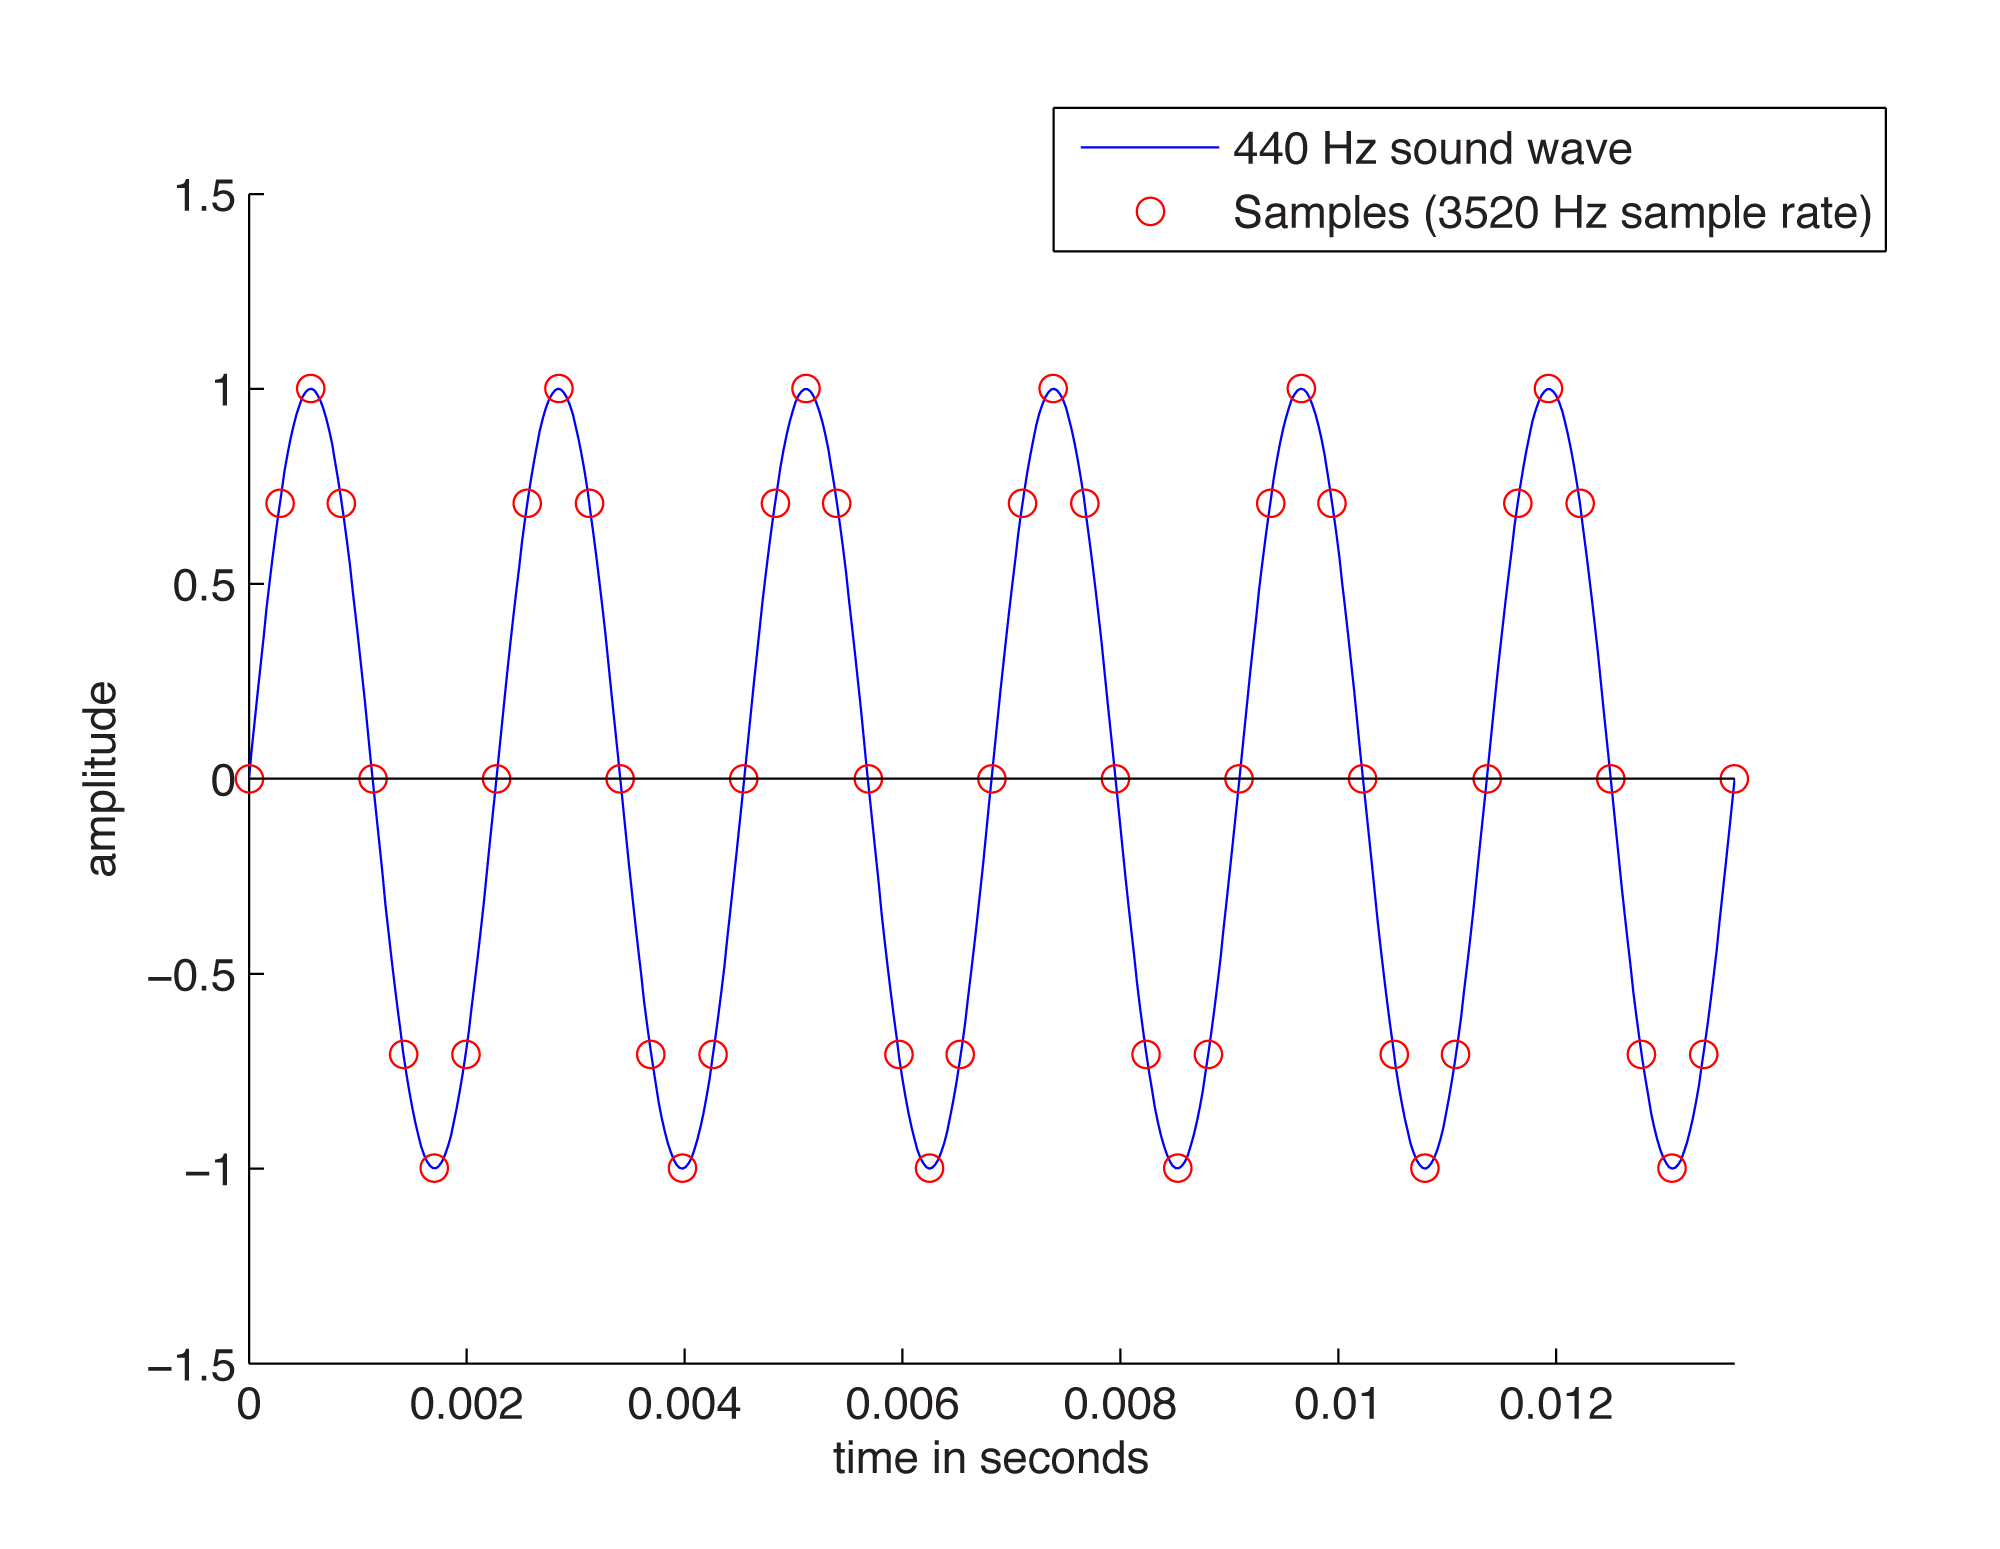
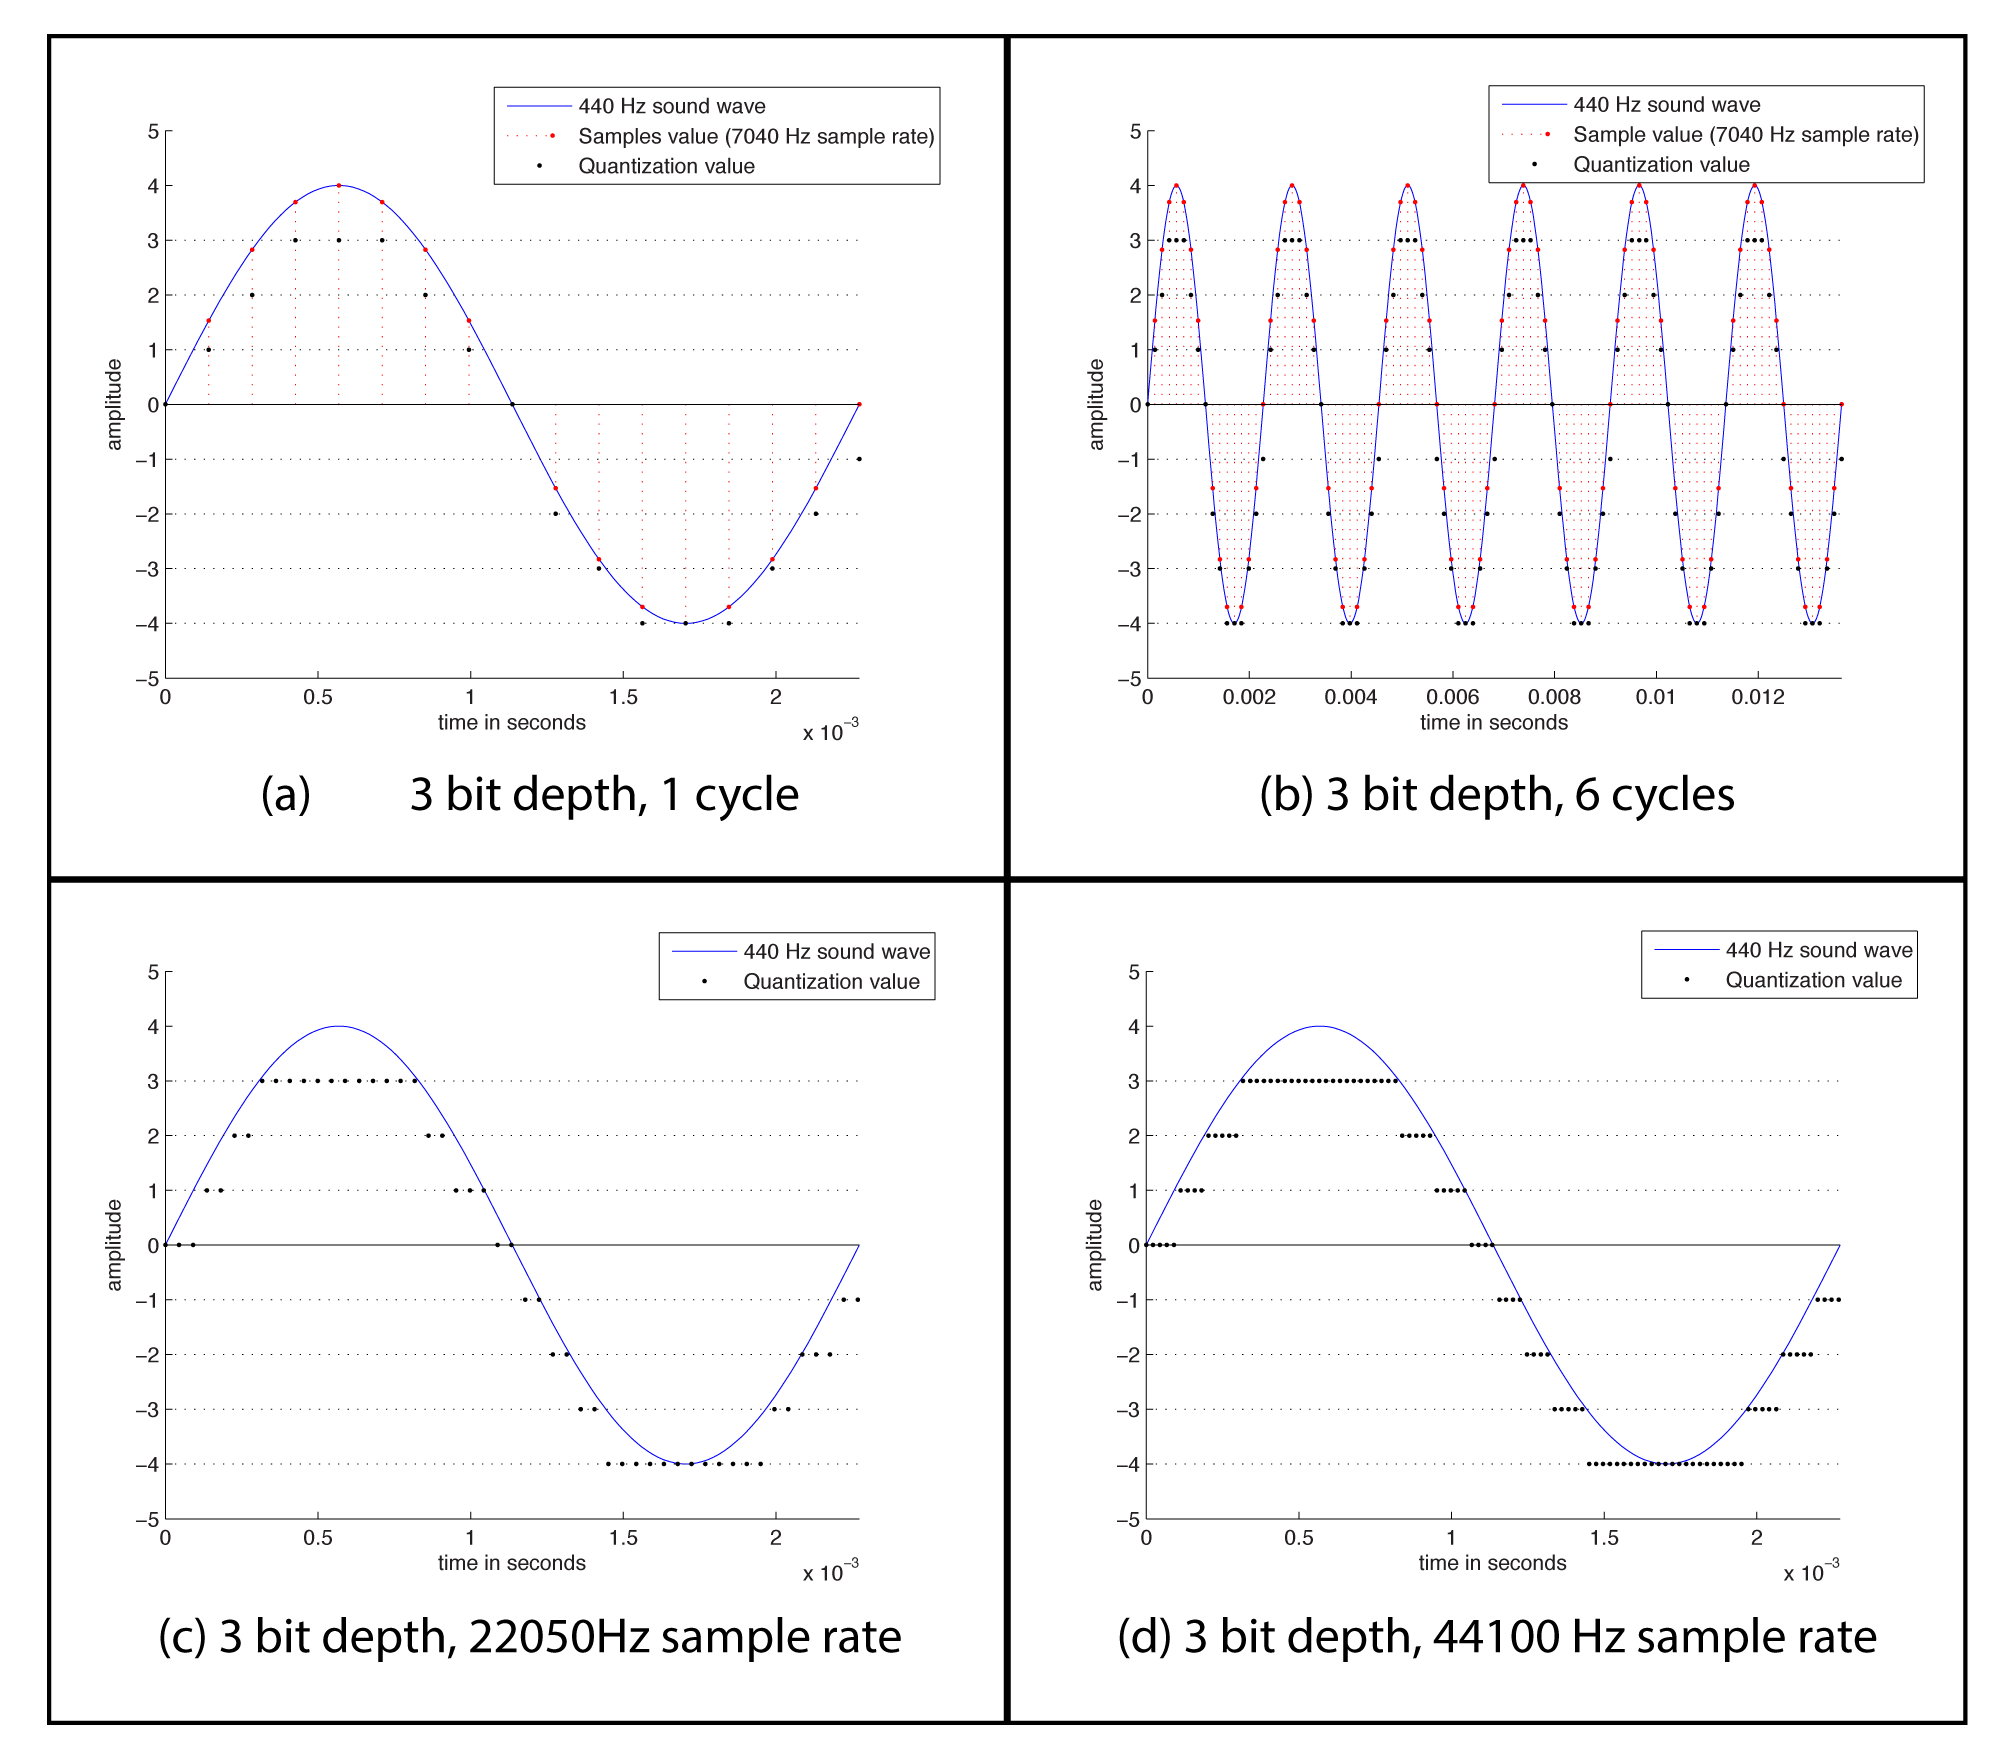
Figure 5.4 shows eight samples being taken for each cycle of the sound wave. The samples are represented as circles along the waveform. The sound wave has a frequency of 440 cycles/s (440 Hz), and the sampling rate has a frequency of 3520 samples/s (3520 Hz). The samples are stored as binary numbers. From these stored values, the amplitude of the digitized sound can be recreated and turned into analog voltage changes by the DAC.
The quantity of these stored values that exists within a given amount of time, as defined by the sampling rate, is important to capturing and recreating the frequency content of the audio signal. The higher the frequency content of the audio signal, the more samples per second (higher sampling rate) are needed to accurately represent it in the digital domain. Consider what would happen if only one sample was taken for every one-and-a-quarter cycles of the sound wave, as pictured in Figure 5.5. This would not be enough information for the DAC to correctly reconstruct the sound wave. Some cycles have been “jumped over” by the sampling process. In the figure, the higher-frequency wave is the original analog 440 Hz wave.
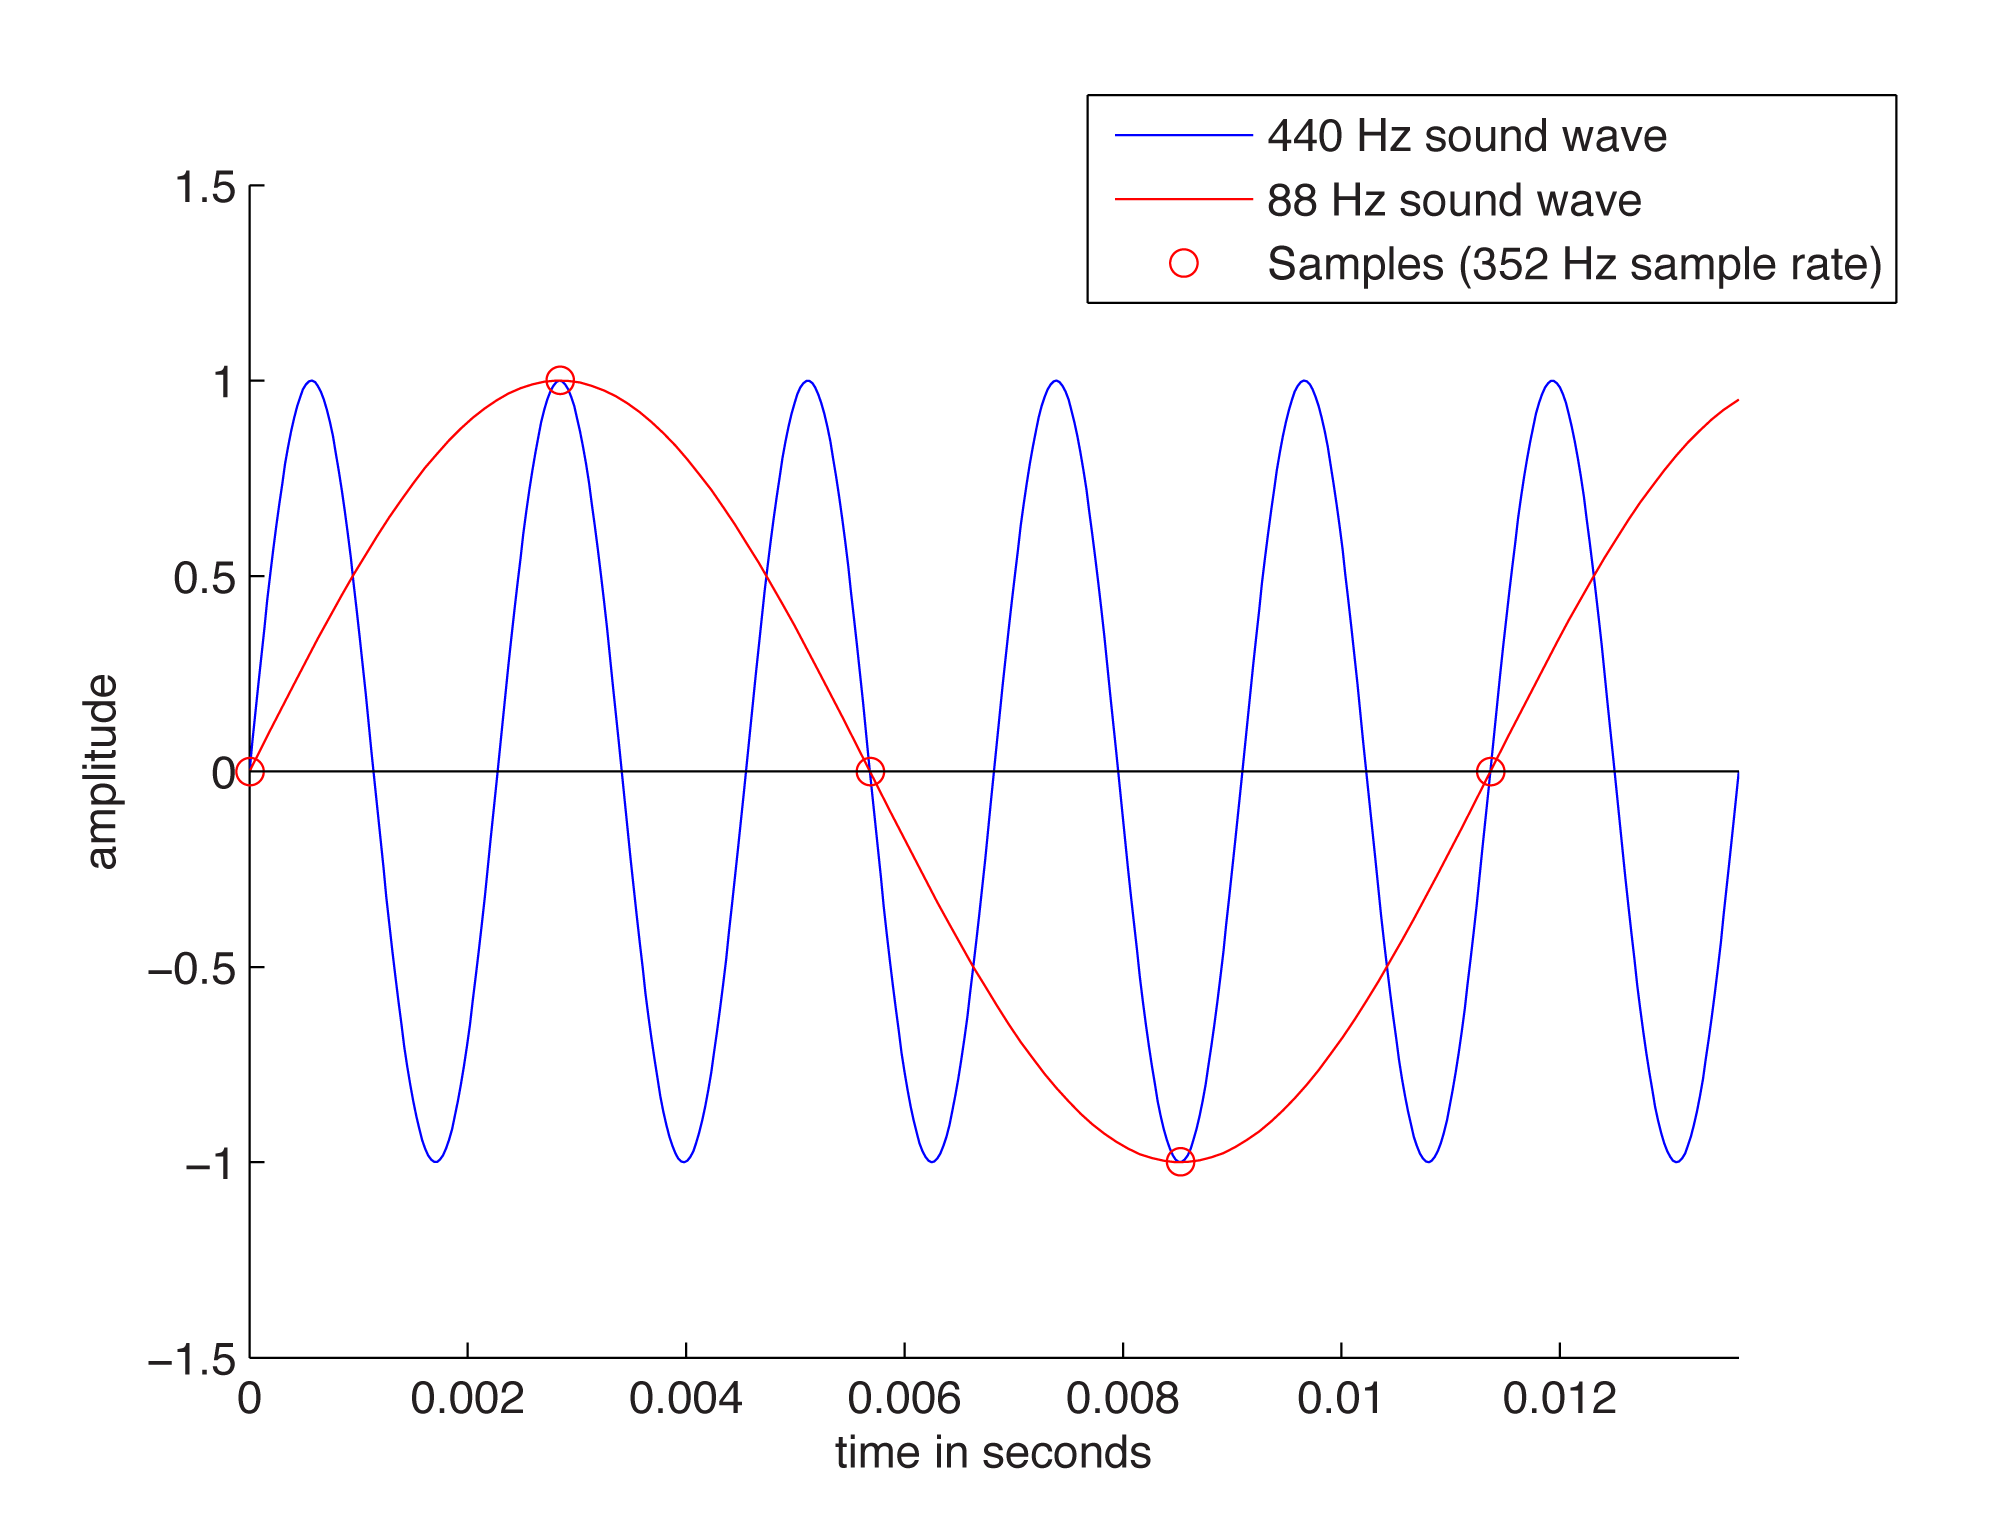
When the sampling rate is too low, the reconstructed sound wave appears to be lower-frequency than the original sound (or have an incorrect frequency component, in the case of a complex sound wave). This is a phenomenon called aliasing – the incorrect digitization of a sound frequency component resulting from an insufficient sampling rate.
For a single-frequency sound wave to be correctly digitized, the sampling rate must be at least twice the frequency of the sound wave. More generally, for a sound with multiple frequency components, the sampling rate must be at least twice the frequency of the highest frequency component. This is known as the Nyquist theorem.
[equation]
The Nyquist Theorem
Given a sound with maximum frequency component of f Hz, a sampling rate of at least 2f is required to avoid aliasing. The minimum acceptable sampling rate (2f in this context) is called the Nyquist rate.
Given a sampling rate of f, the highest-frequency sound component that can be correctly sampled is f/2. The highest frequency component that can be correctly sampled is called the Nyquist frequency.
[/equation]
In practice, aliasing is generally not a problem. Standard sampling rates in digital audio recording environments are high enough to capture all frequencies in the human-audible range. The highest audible frequency is about 20,000 Hz. In fact, most people don’t hear frequencies this high, as our ability to hear high frequencies diminishes with age. CD quality sampling rate is 44,100 Hz (44.1 kHz), which is acceptable as it is more than twice the highest audible component. In other words, with CD quality audio, the highest frequency we care about capturing (20 kHz for audibility purposes) is less than the Nyquist frequency for that sampling rate, so this is fine. A sampling rate of 48 kHz is also widely supported, and sampling rates go up as high as 192 kHz.
Even if a sound contains frequency components that are above the Nyquist frequency, to avoid aliasing the ADC generally filters them out before digitization.
Section 5.3.1 gives more detail about the mathematics of aliasing and an algorithm for determining the frequency of the aliased wave in cases where aliasing occurs.
5.1.2.3 Bit Depth and Quantization Error
When samples are taken, the amplitude at that moment in time must be converted to integers in binary representation. The number of bits used for each sample, called the bit depth, determines the precision with which you can represent the sample amplitudes. For this discussion, we assume that you know that basics of binary representation, but let’s review briefly.
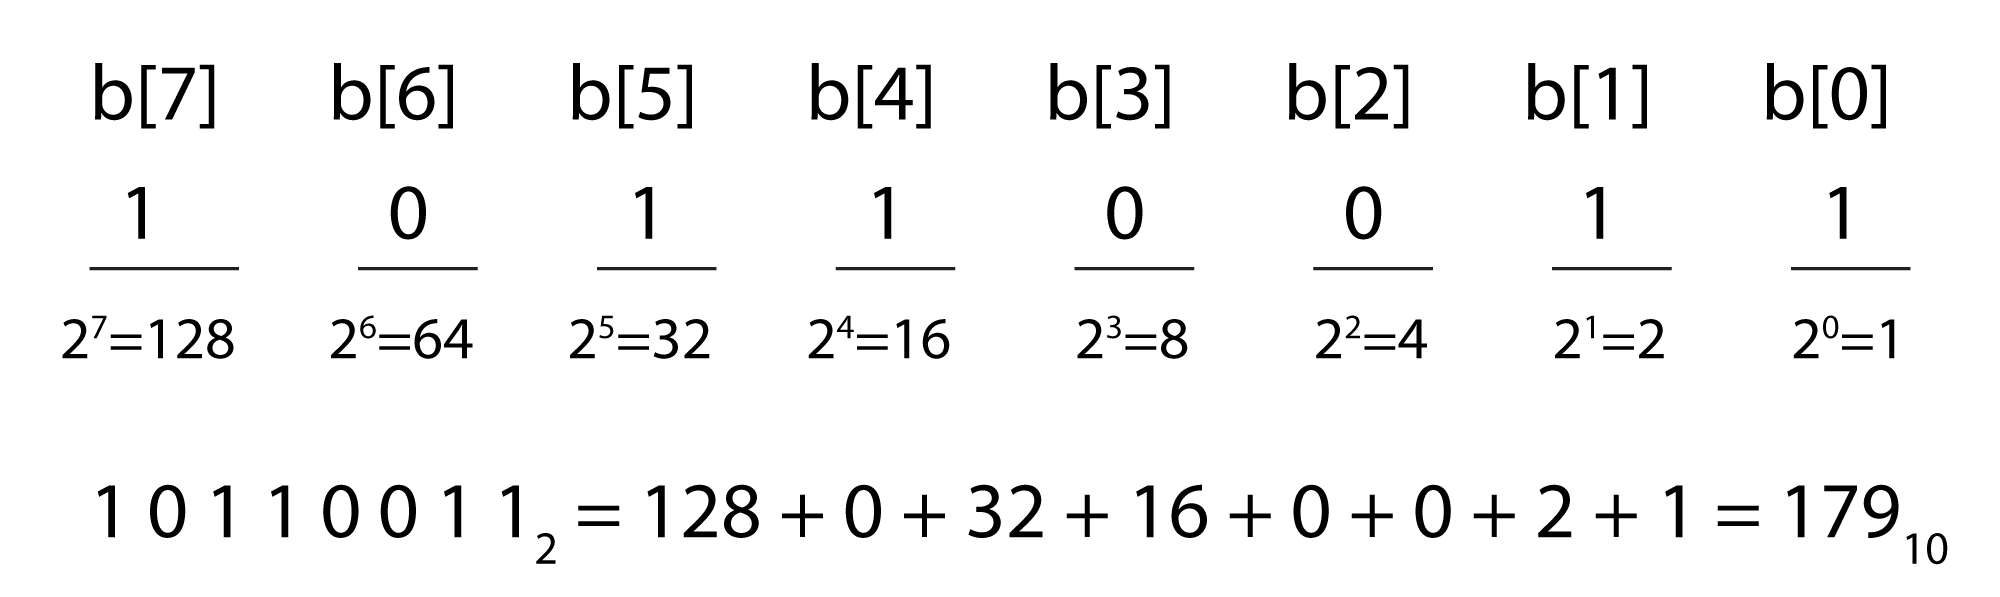
Binary representation, the fundamental language of computers, is a base 2 number system. Each bit in a binary number holds either a 1 or a 0. Eight bits together constitute one byte. The bit positions in a binary number are numbered from right to left starting at 0, as shown in Figure 5.6. The rightmost bit is called the least significant bit, and the leftmost is called the most significant bit. The ith bit is called b[i] .
The value of an n-bit binary number is equal to
[equation caption=”Equation 5.1″]
$$!\sum_{t=0}^{n-1}b\left [ i \right ]\ast 2^{i}$$
[/equation]
Notice that doing the summation from causes the terms in the sum to be in the reverse order from that shown in Figure 5.6. The summation for our example is
$$!10110011_{2}=1\ast 1+1\ast 2+0\ast 4+0\ast 8+1\ast 16+1\ast 32+0\ast 64+1\ast 128=179_{10}$$
Thus, 10110011 in base 2 is equal to 179 in base 10. (Base 10 is also called decimal.) We leave off the subscript 2 in binary numbers and the subscript 10 in decimal numbers when the base is clear from the context.
From the definition of binary numbers, it can be seen that the largest decimal number that can be represented with an n-bit binary number is $$2^{n}-1$$, and the number of different values that can be represented is $$2^{n}$$. For example, the decimal values that can be represented with an 8-bit binary number range from 0 to 255, so there are 256 different values.
These observations have significance with regard to the bit depth of a digital audio recording. A bit depth of 8 allows 256 different discrete levels at which samples can be recorded. A bit depth of 16 allows 216 = 65,536 discrete levels, which in turn provides much higher precision than a bit depth of 8.
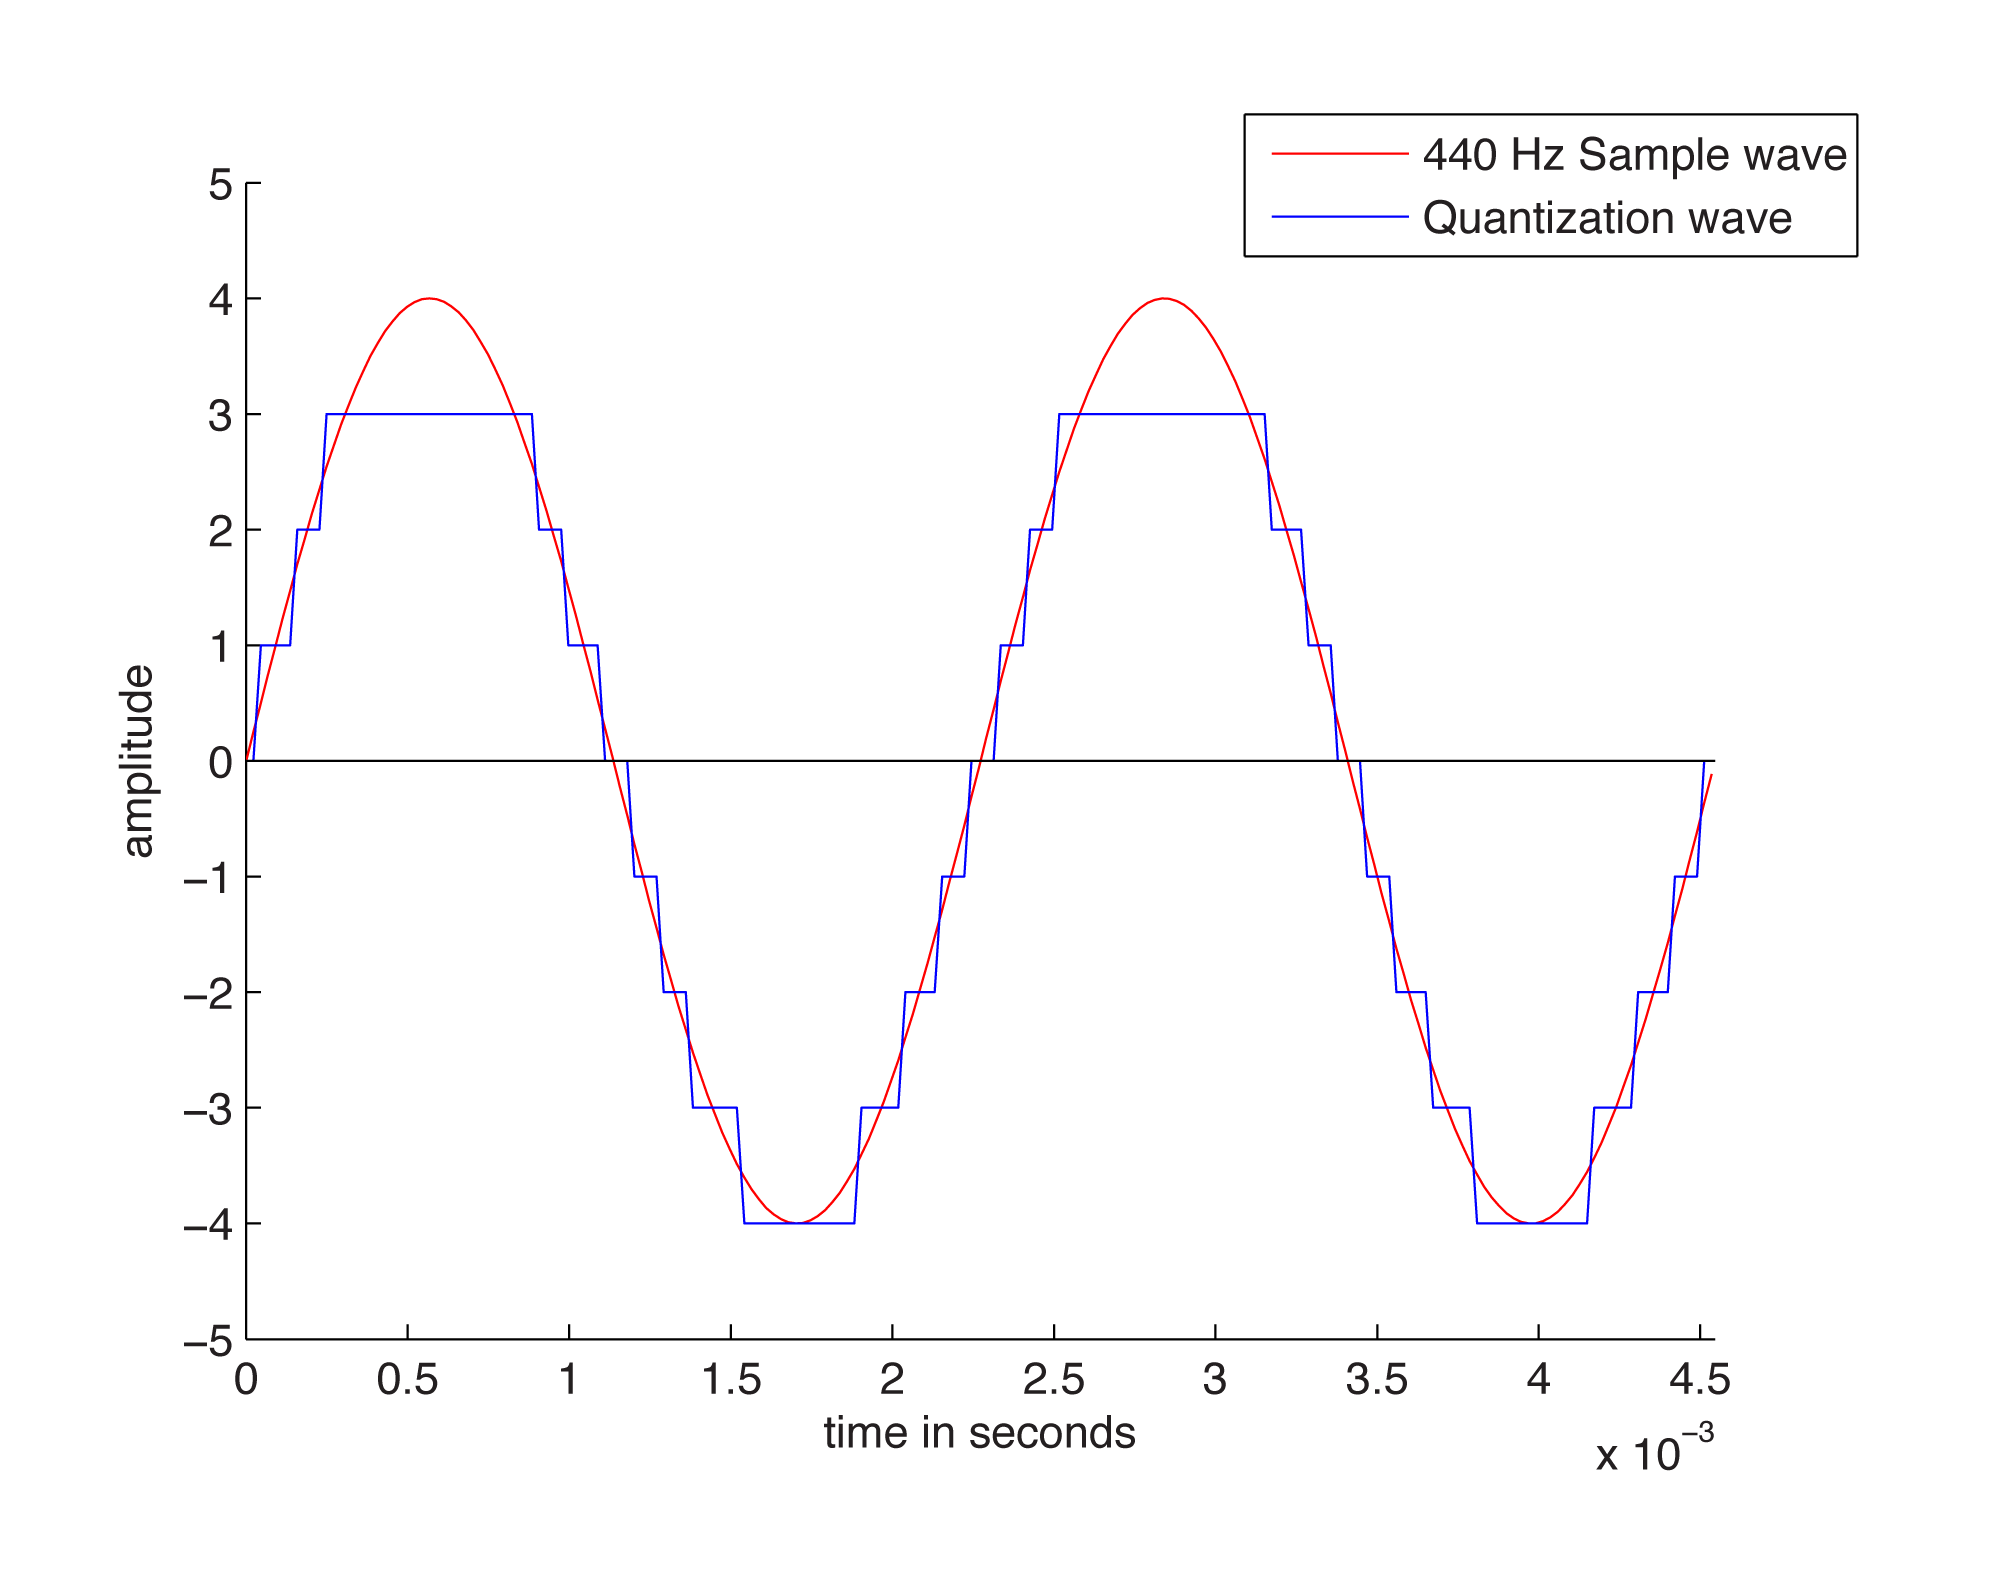
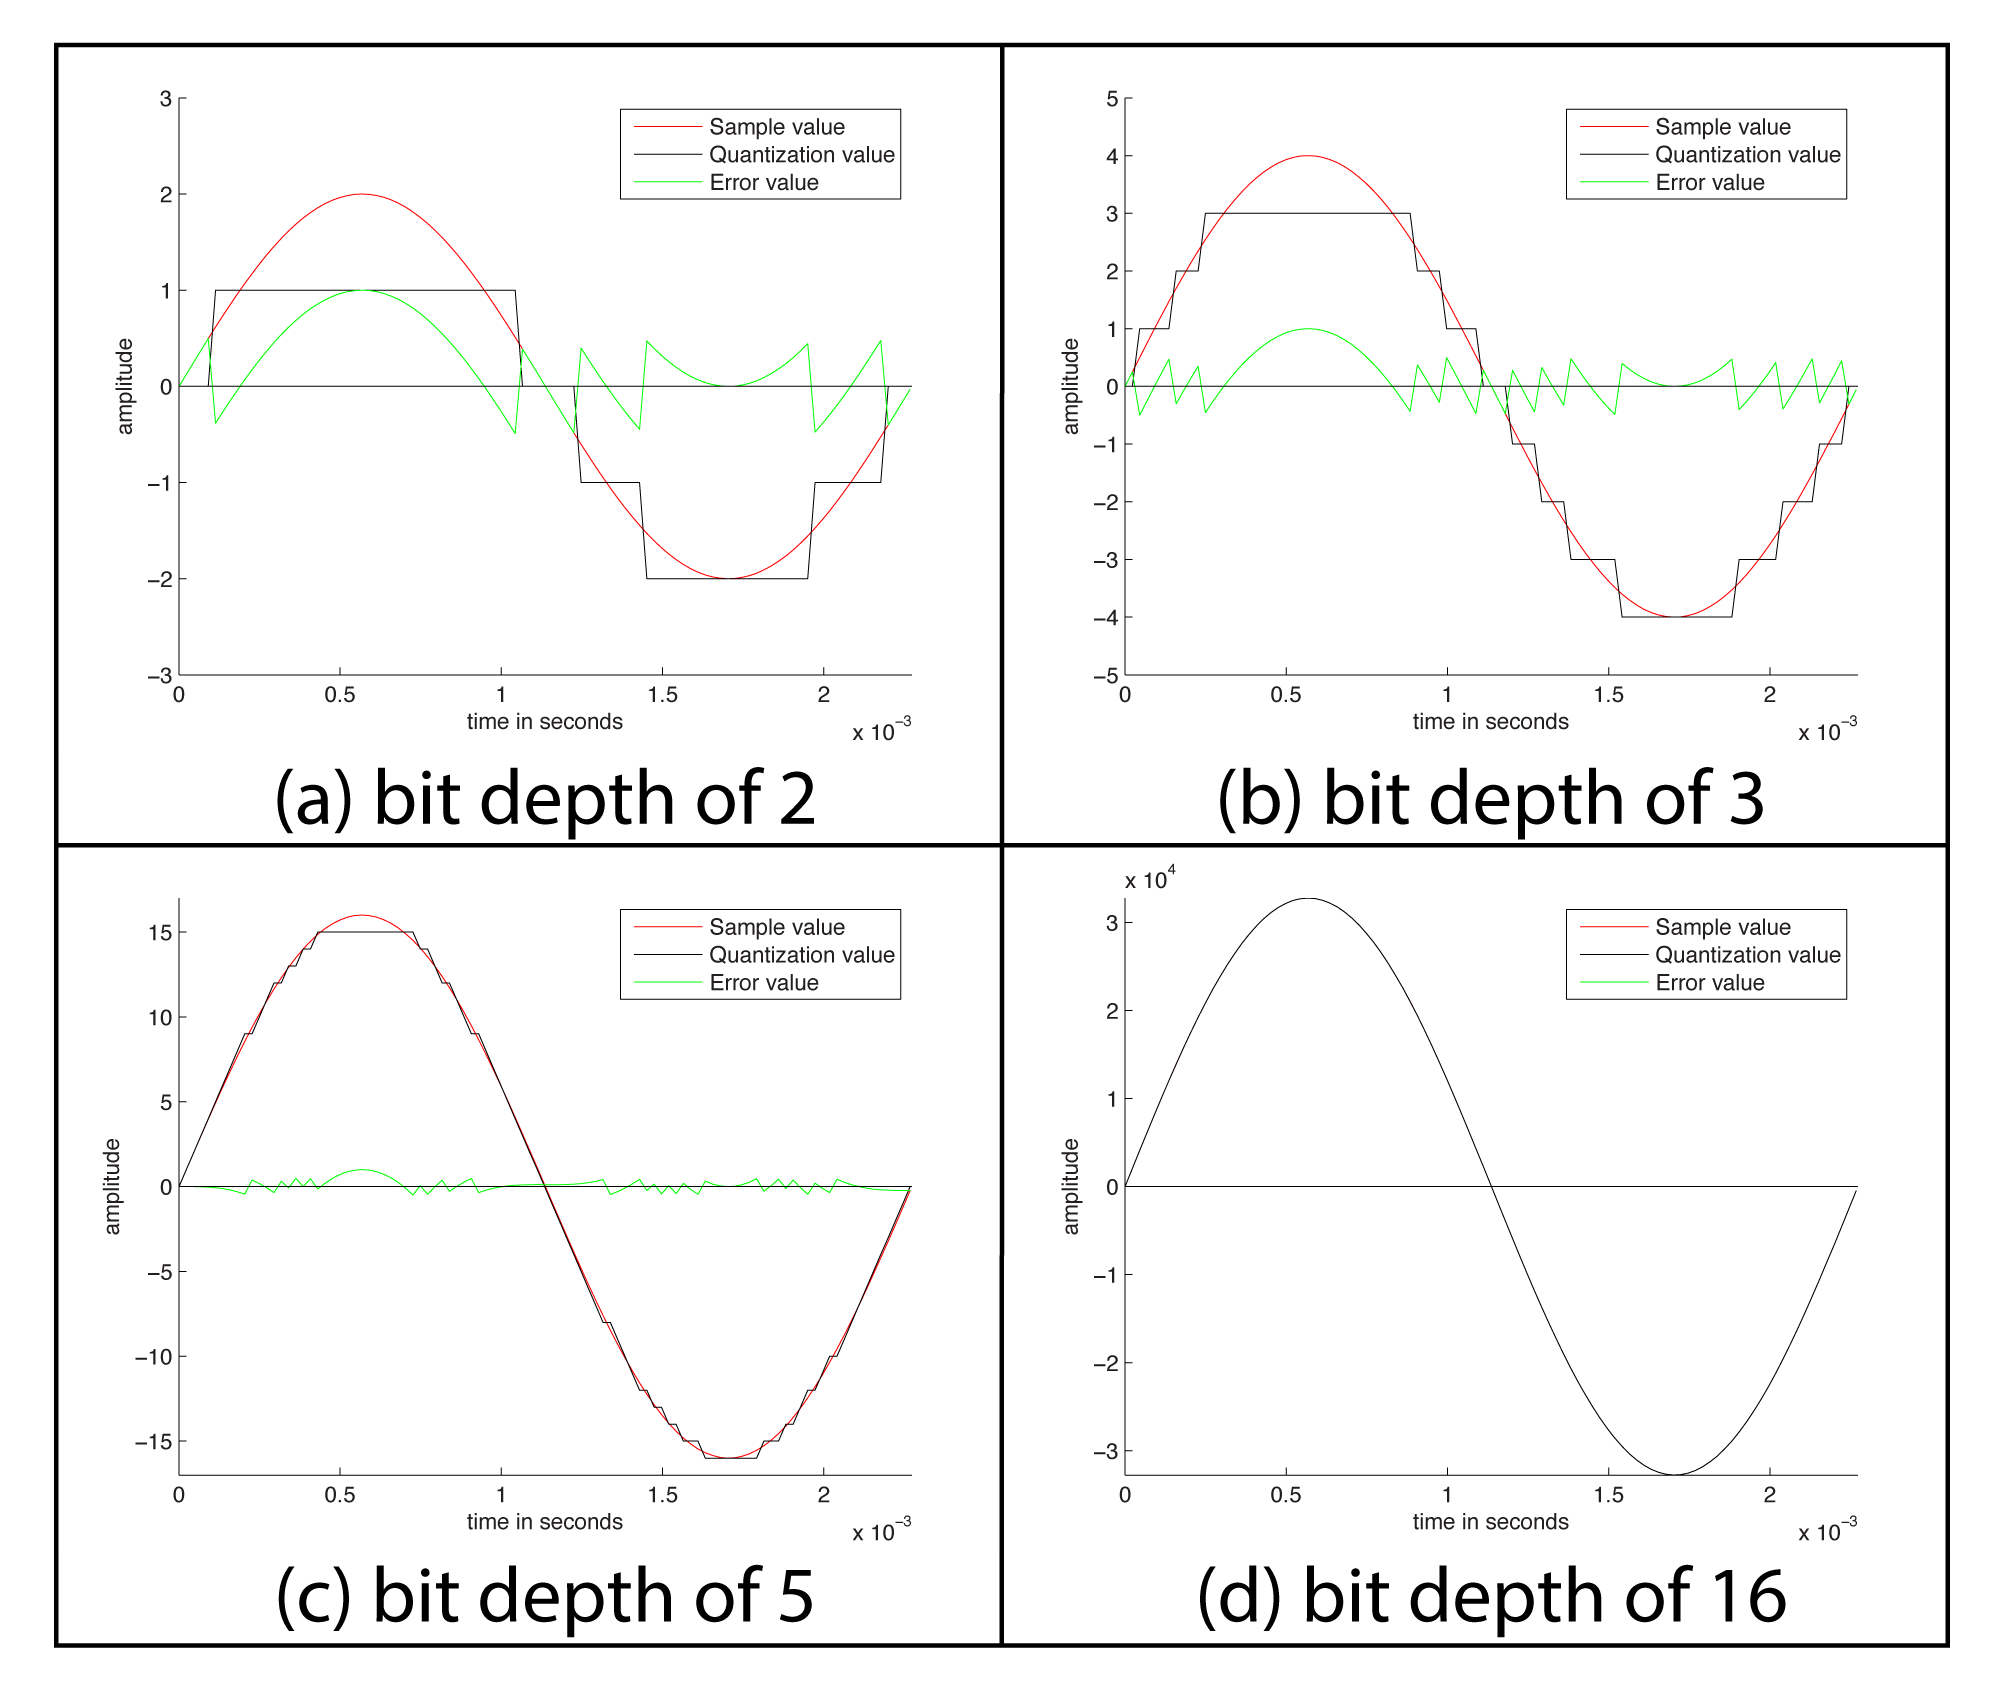
The process of quantization is illustrated Figure 5.7. Again, we model a single-frequency sound wave as a sine function, centering the sine wave on the horizontal axis. We use a bit depth of 3 to simplify the example, although this is far lower than any bit depth that would be used in practice. With a bit depth of 3, 23 = 8 quantization levels are possible. By convention, half of the quantization levels are below the horizontal axis (that is, $$2^{n-1}$$ of the quantization levels). One level is the horizontal axis itself (level 0), and $$2^{n-1}-1$$ levels are above the horizontal axis. These levels are labeled in the figure, ranging from -4 to 3. When a sound is sampled, each sample must be scaled to one of $$2^{n}$$ discrete levels. However, the samples in reality might not fall neatly onto these levels. They have to be rounded up or down by some consistent convention. We round to the nearest integer, with the exception that values at 3.5 and above are rounded down to 3. The original sample values are represented by red dots on the graphs. The quantized values are represented as black dots. The difference between the original samples and the quantized samples constitutes rounding error. The lower the bit depth, the more values potentially must be rounded, resulting in greater quantization error. Figure 5.8 shows a simple view of the original wave vs. the quantized wave.
[wpfilebase tag=file id=117 tpl=supplement /]
Quantization error is sometimes referred to as noise. Noise can be broadly defined as part of an audio signal that isn’t supposed to be there. However, some sources would argue that a better term for quantization error is distortion, defining distortion as an unwanted part of an audio signal that is related to the true signal. If you subtract the stair-step wave from the true sine wave in Figure 5.8, you get the green part of the graphs in Figure 5.9. This is precisely the error – i.e., the distortion – resulting from quantization. Notice that the error follows a regular pattern that changes in tandem with the original “correct” sound wave. This makes the distortion sound more noticeable in human perception, as opposed to completely random noise. The error wave constitutes sound itself. If you take the sample values that create the error wave graph in Figure 5.9, you can actually play them as sound. You can compare and listen to the effects of various bit depths and the resulting quantization error in the Max Demo “Bit Depth” linked to this section.

For those who prefer to distinguish between noise and distortion, noise is defined as an unwanted part of an audible signal arising from environmental interference – like background noise in a room where a recording is being made, or noise from the transmission of an audio signal along wires. This type of noise is more random than the distortion caused by quantization error. Section 3 shows you how you can experiment with sampling and quantization in MATLAB, C++, and Java programming to understand the concepts in more detail.
5.1.2.4 Dynamic Range
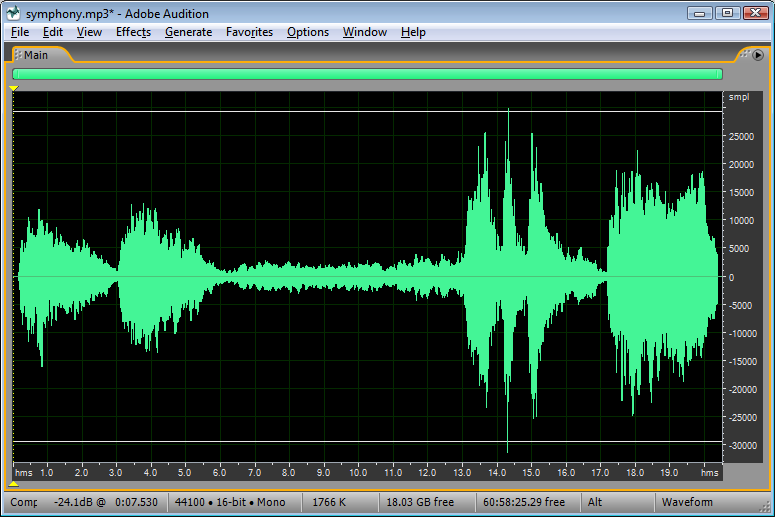
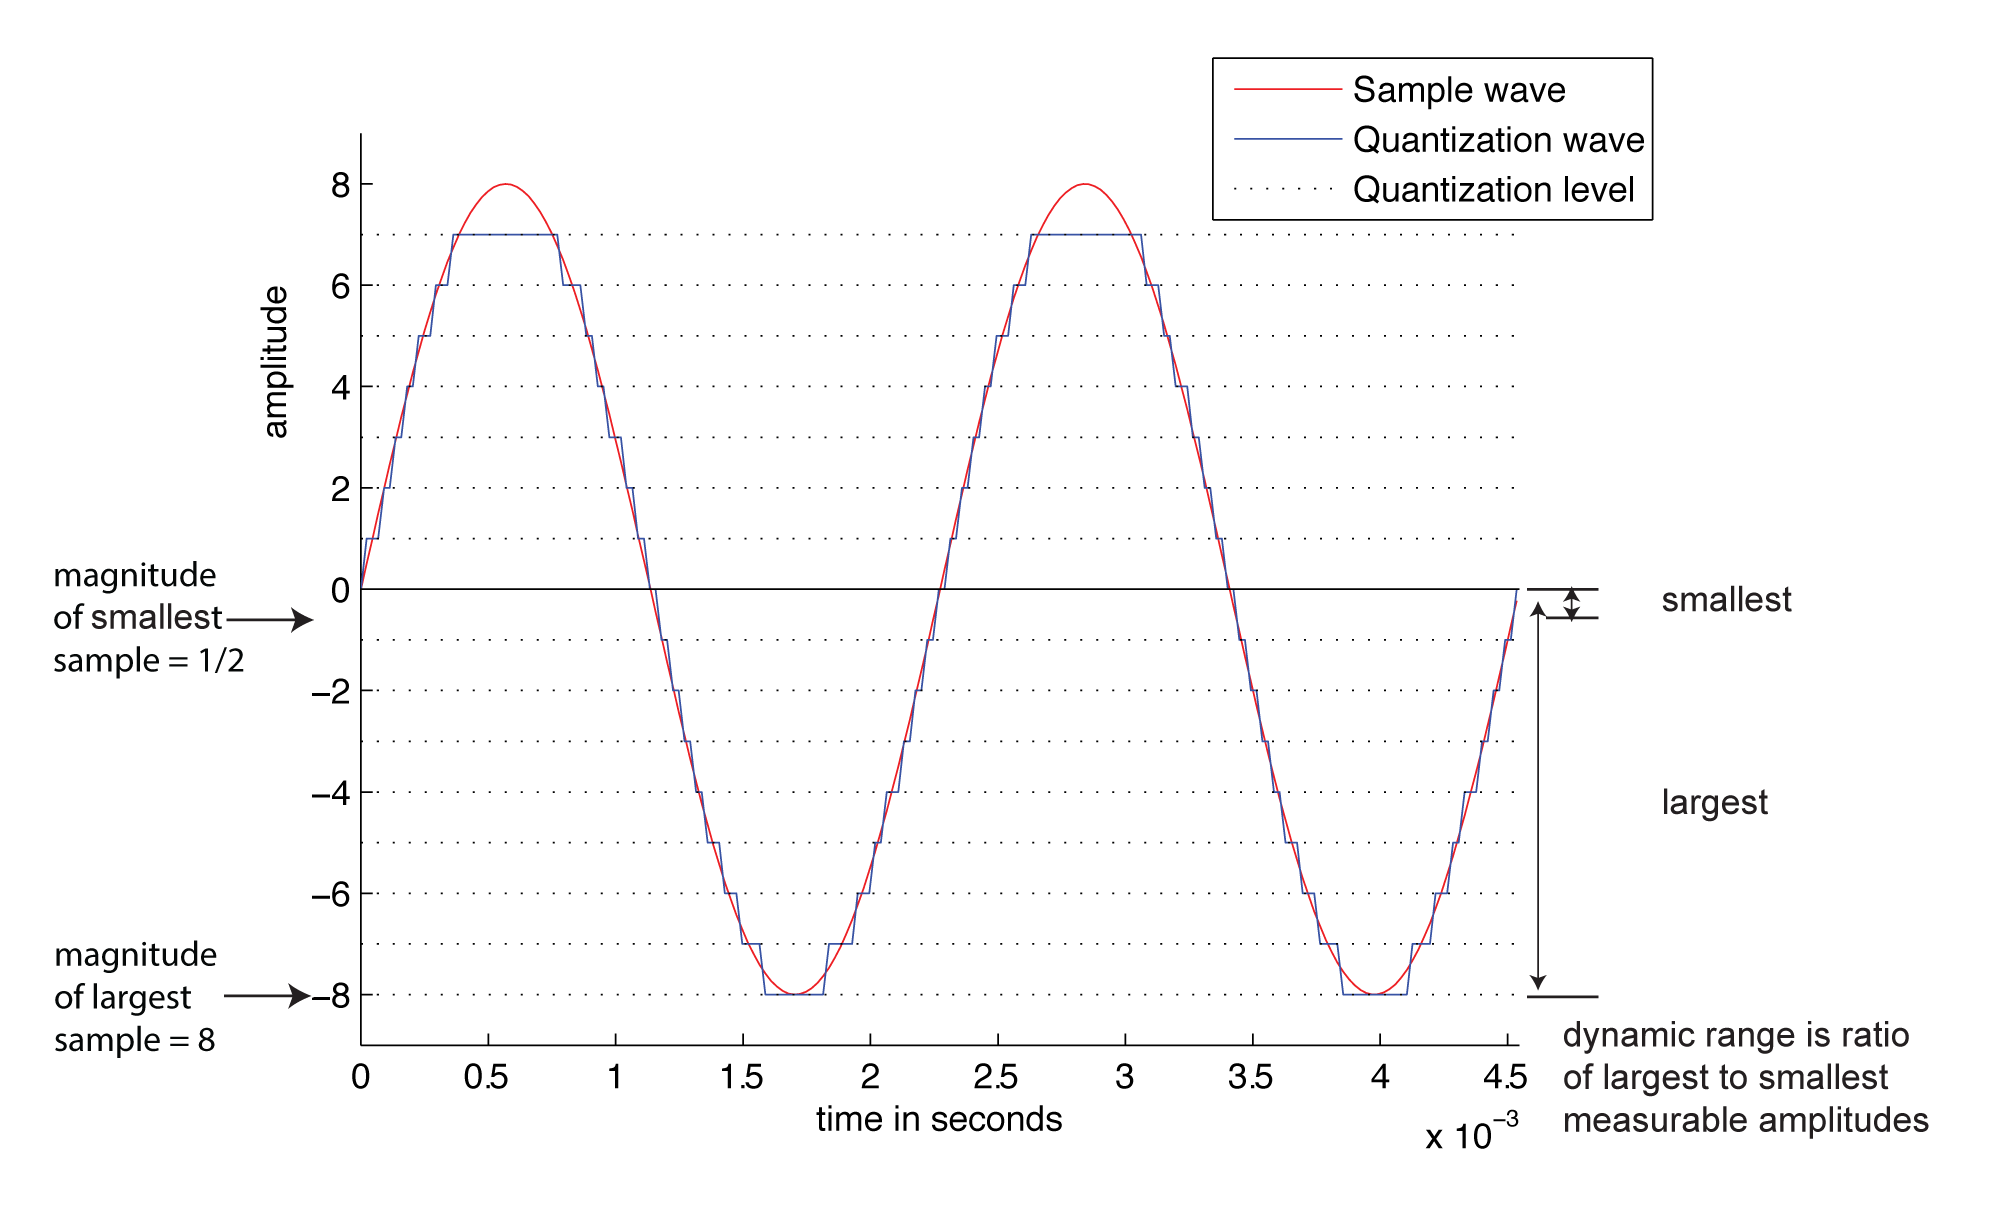
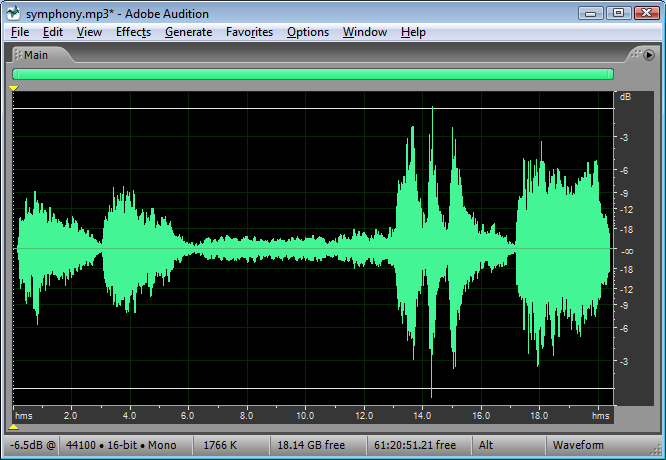
Another way to view the implications of bit depth and quantization error is in terms of dynamic range. The term dynamic range has two main usages with regard to sound. First, an occurrence of sound that takes place over time has a dynamic range, defined as the range between the highest and lowest amplitude moments of the sound. This is best illustrated by music. Classical symphonic music generally has a wide dynamic range. For example, “Beethoven’s Fifth Symphony” begins with a high amplitude “Bump bump bump baaaaaaaa” and continues with a low-amplitude string section. The difference between the loud and quiet parts is intentionally dramatic and is what gives the piece a wide dynamic range. You can see this in the short clip of the symphony graphed in Figure 5.10. The dynamic range of this clip is a function of the ratio between the largest sample value and the magnitude of the smallest. Notice that you don’t measure the range across the horizontal access but from the highest-magnitude sample either above or below the axis to the lowest-magnitude sample on the same side of the axis. A sound clip with a narrow dynamic range has a much smaller difference between the loud and quiet parts. In this usage of the term dynamic range, we’re focusing on the dynamic range of a particular occurrence of sound or music.
[aside]
MATLAB Code for Figure 5.11 and Figure 5.12:
hold on;
f = 440;T = 1/f;
Bdepth = 3; bit depth
Drange = 2^(Bdepth-1); dynamic range
axis = [0 2*T -(Drange+1) Drange+1];
SRate = 44100; %sample rate
sample_x = (0:2*T*SRate)./SRate;
sample_y = Drange*sin(2*pi*f*sample_x);
plot(sample_x,sample_y,'r-');
q_y = round(sample_y); %quantization value
for i = 1:length(q_y)
    if q_y(i) == Drange
       q_y(i) = Drange-1;
    end
end
plot(sample_x,q_y,'-')
for i = -Drange:Drange-1 %quantization level
    y = num2str(i); fplot(y,axis,'k:')
end
legend('Sample wave','Quantization wave','Quantization level')
y = '0'; fplot(y,axis,'k-')
ylabel('amplitude');xlabel('time in seconds');
hold off;
[/aside]
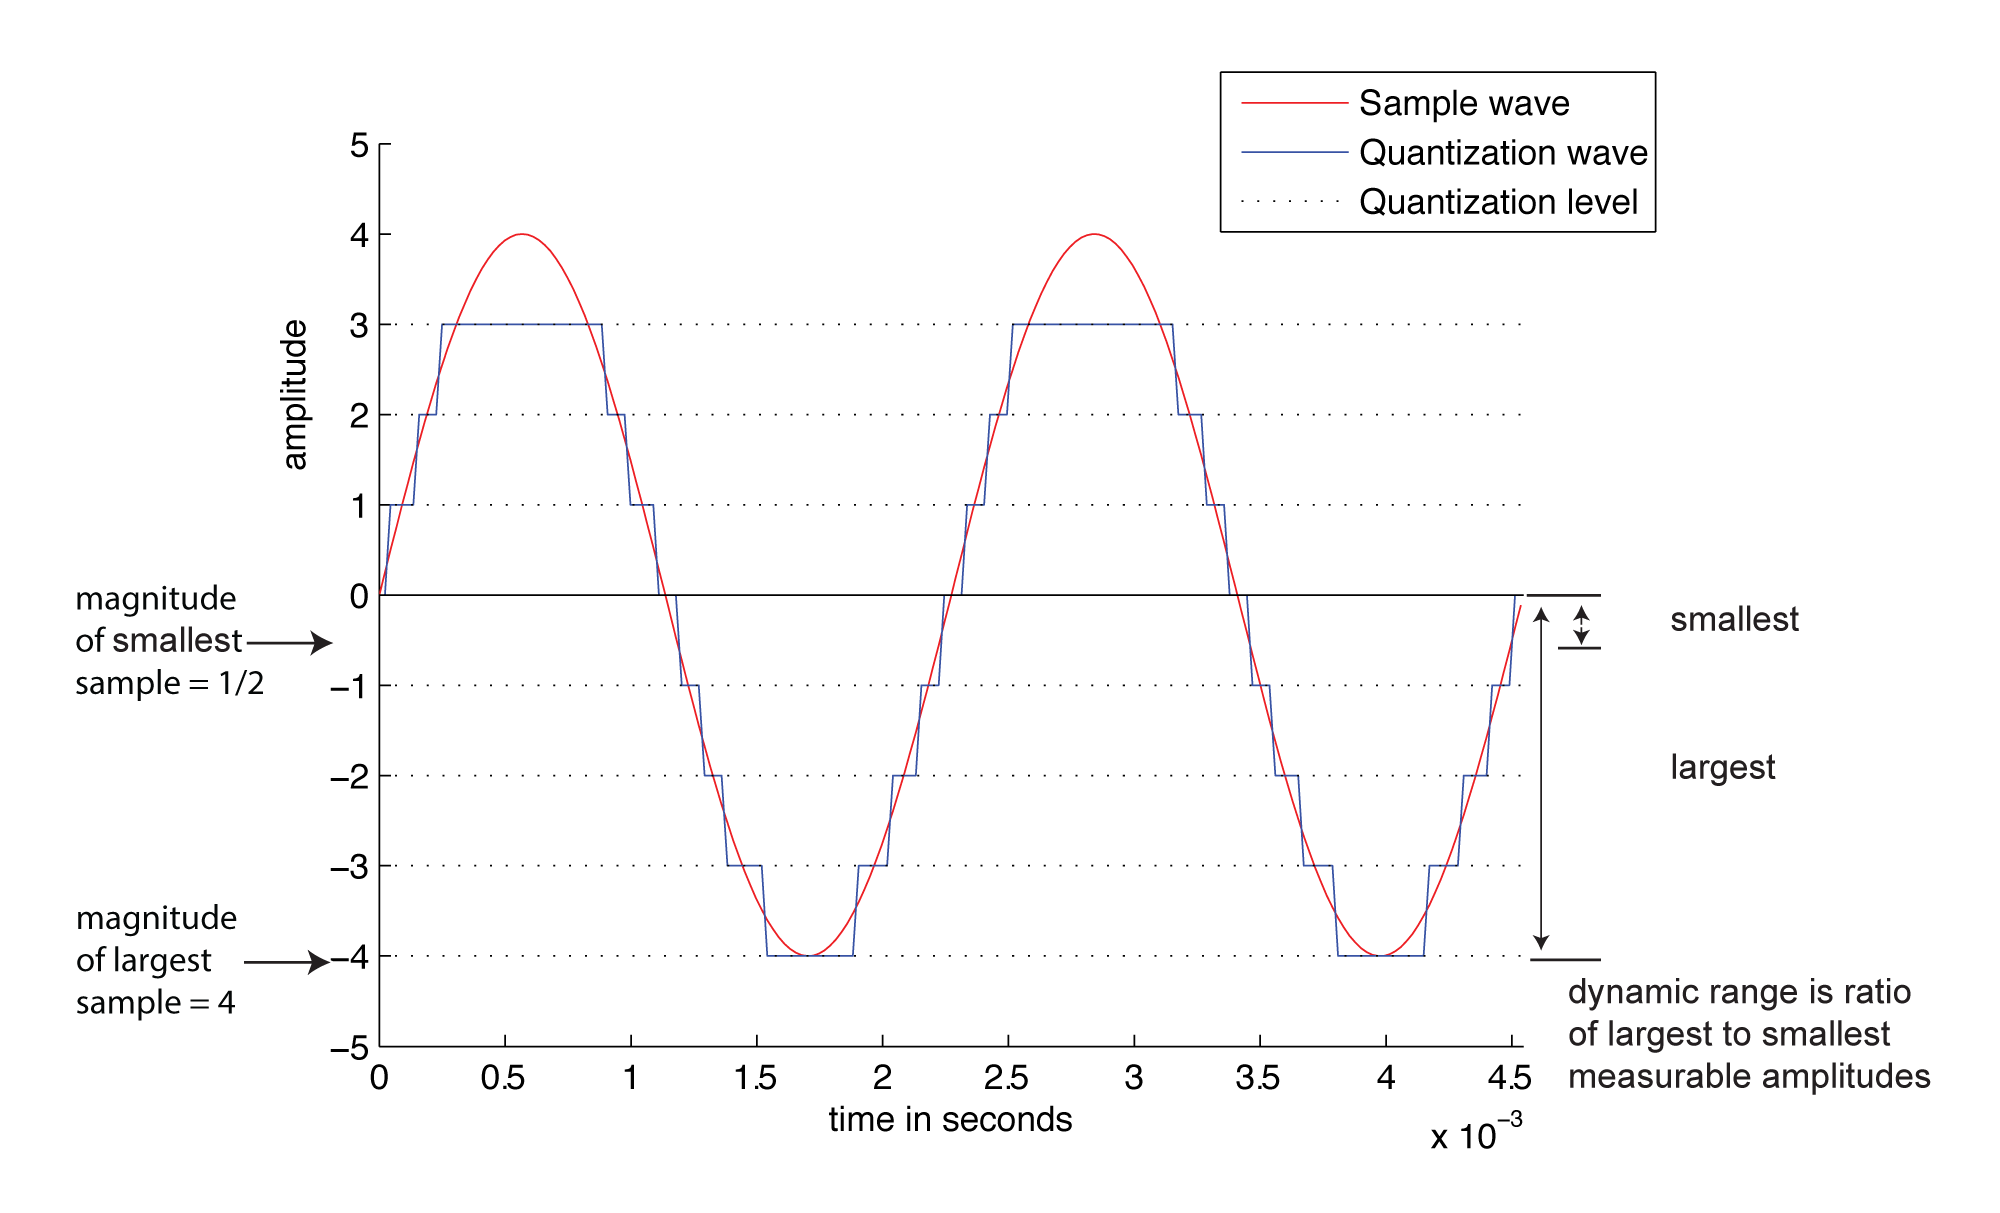
In another usage of the term, the potential dynamic range of a digital recording refers to the possible range of high and low amplitude samples as a function of the bit depth. Choosing the bit depth for a digital recording automatically constrains the dynamic range, a higher bit depth allowing for a wider dynamic range.
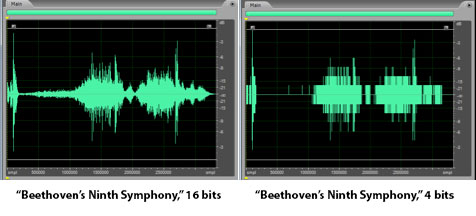
Consider how this works. A digital recording environment has a maximum amplitude level that it can record. On the scale of n-bit samples, the maximum amplitude (in magnitude) would be $$2_{n-1}$$. The question is this: How far, relatively, can the audio signal fall below the maximum level before it is rounded down to silence? The figures below show the dynamic range at a bit depth of 3 (Figure 5.11) compared to the dynamic range at a bit depth of 4 (Figure 5.12). Again, these are non-practical bit depths chosen for simplicity of illustration. The higher bit depth gives a wider range of sound amplitudes that can be recorded. The smaller bit depth loses more of the quiet sounds when they are rounded down to zero or overpowered by the quantization noise. You can see this in the right hand view of Figure 5.13, where a portion of “Beethoven’s Ninth Symphony” has been reduced to four bits per sample.
[wpfilebase tag=file id=40 tpl=supplement /]
The term dynamic range has a precise mathematical definition that relates back to quantization error. In the context of music, we encountered dynamic range as a ratio between the loudest and quietest musical passages of a song or performance. Digitally, the loudest potential passage of the music (or other audio signal) that could be represented would have full amplitude (all bits on). The quietest possible passage is the quantization noise itself. Any sound quieter than that would simply be masked by the noise or rounded down to silence. The ratio between the loudest and quietest parts is therefore the highest (possible) amplitude of the audio signal compared to the amplitude of the quantization noise, or the ratio between the signal level to the noise level. This is what is known as signal-to-quantization-noise-ratio (SQNR), and in this context, dynamic range is the same thing. This definition is given in Equation 5.2.
[equation caption=”Equation 5.2″]
Given a bit depth of n, the dynamic range of a digital audio recording is equal to
$$!20\log_{10}\left ( \frac{2^{n-1}}{1/2} \right )dB$$
[/equation]
You can see from the equation that dynamic range as SQNR is measured in decibels. Decibels are a dimensionless unit derived from the logarithm of the ratio between two values. For sound, decibels are based on the ratio between the air pressure amplitude of a given sound and the air pressure amplitude of the threshold of hearing. For dynamic range, decibels are derived from the ratio between the maximum and minimum amplitudes of an analog waveform quantized with n bits. The maximum magnitude amplitude is $$2^{n-1}$$. The minimum amplitude of an analog wave that would be converted to a non-zero value when it is quantized is ½. Signal-to-quantization-noise is based on the ratio between these maximum and minimum values for a given bit depth. It turns out that this is exactly the same value as the dynamic range.
Equation 5.2 can be simplified as shown in Equation 5.3.
[equation caption=”Equation 5.3″]
$$!20\log_{10}\left ( \frac{2^{n-1}}{1/2} \right )=20\log_{10}\left ( 2^{n} \right )=20n\log_{10}\left ( 2 \right )\approx 6.04n$$
[/equation]
[wpfilebase tag=file id=118 tpl=supplement /]
Equation 5.3 gives us a method for determining the possible dynamic range of a digital recording as a function of the bit depth. For bit depth n, the possible dynamic range is approximately 6n dB. A bit depth of 8 gives a dynamic range of approximately 48 dB, a bit depth of 16 gives a dynamic range of about 96 dB, and so forth.
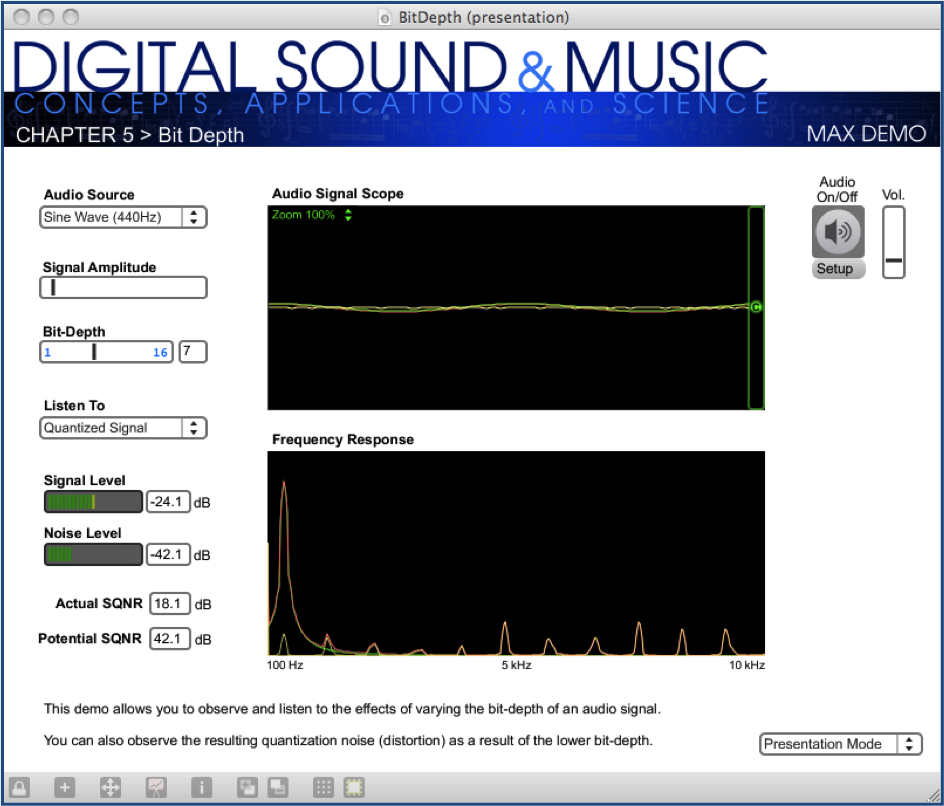
When we introduced this section, we added the adjective “potential” to “dynamic range” to emphasize that it is the maximum possible range that can be used as a function of the bit depth. But not all of this dynamic range is used if the amplitude of a digital recording is relatively low, never reaching its maximum. Thus, we it is important to consider the actual dynamic range (or actual SQNR) as opposed to the potential dynamic range (or potential SQNR, just defined). Take, for example, the situation illustrated in Figure 5.15. A bit depth of 7 has been chosen. The amplitude of the wave is 24 dB below the maximum possible. Because the sound uses so little of its potential dynamic range, the actual dynamic range is small. We’ve used just a simple sine wave in this example so that you can easily see the error wave in proportion to the sine wave, but you can imagine a music recording that has a low actual dynamic range because the recording was done at a low level of amplitude. The difference between potential dynamic range and actual dynamic range is illustrated in detail in the interactive Max demo associated with this section. This demo shows that, in addition to choosing a bit depth appropriately to provide sufficient dynamic range for a sound recording, it’s important that you use the available dynamic range optimally. This entails setting microphone input voltage levels so that the loudest sound produced is as close as possible to the maximum recordable level. These practical considerations are discussed further in Section 5.2.2.
We have one more related usage of decibels to define in this section. In the interface of many software digital audio recording environments, you’ll find that decibels-full-scale (dBFS) is used. (In fact, it is used in the Signal and Noise Level meters in Figure 5.15.) As you can see in Figure 5.16, which shows amplitude in dBFS, the maximum amplitude is 0 dBFS, at equidistant positions above and below the horizontal axis. As you move toward the horizontal axis (from either above or below) through decreasing amplitudes, the dBFS values become increasingly negative.
The equation for converting between dB and dBFS is given in Equation 5.4
[equation caption=”Equation 5.4″]
For n-bit samples, decibels-full-scale (dBFS) is defined as follows:
$$!dBFS=20\log_{10}\left ( \frac{x}{2^{n-1}} \right )$$
where $$x$$ is an integer sample value between 0 and $$2^{n-1}$$.
[/equation]
Generally, computer-based sample editors allow you to select how you want the vertical axis labeled, with choices including sample values, percentage, values normalized between -1 and 1, and dBFS.
Chapter 7 goes into more depth about dynamics processing, the adjustment of dynamic range of an already-digitized sound clip.
5.1.2.5 Audio Dithering and Noise Shaping
It’s possible to take an already-recorded audio file and reduce its bit depth. In fact, this is commonly done. Many audio engineers keep their audio files at 24 bits while they’re working on them, and reduce the bit depth to 16 bits when they’re finished processing the files or ready to burn to an audio CD. The advantage of this method is that when the bit depth is higher, less error is introduced by processing steps like normalization or adjustment of dynamics. Because of this advantage, even if you choose a bit depth of 16 from the start, your audio processing system may be using 24 bits (or an even higher bit depth) behind the scenes anyway during processing, as is the case with Pro Tools.
Audio dithering is a method to reduce the quantization error introduced by a low bit depth. Audio dithering can be used by an ADC when quantization is initially done, or it can be used on an already-quantized audio file when bit depth is being reduced. Oddly enough, dithering works by adding a small amount of random noise to each sample. You can understand the advantage of doing this if you consider a situation where a number of consecutive samples would all round down to 0 (i.e., silence), causing breaks in the sound. If a small random amount is added to each of these samples, some round up instead of down, smoothing over those breaks. In general, dithering reduces the perceptibility of the distortion because it causes the distortion to no longer follow exactly in tandem with the pattern of the true signal. In this situation, low-amplitude noise is a good trade-off for distortion.
Noise shaping is a method that can be used in conjunction with audio dithering to further compensate for bit-depth reduction. It works by raising the frequency range of the rounding error after dithering, putting it into a range where human hearing is less sensitive. When you reduce the bit depth of an audio file in an audio processing environment, you are often given an option of applying dithering and noise shaping, as shown in Figure 5.17 Dithering can be done without noise shaping, but noise shaping is applied only after dithering. Also note that dithering and noise shaping cannot be done apart from the requantization step because they are embedded into the way the requantization is done. A popular algorithm for dithering and noise shaping is the proprietary POW-r (Psychoacoustically Optimized Wordlength Reduction), which is built into Pro Tools, Logic Pro, Sonar, and Ableton Live.
Dithering and noise shaping are discussed in more detail in Section 5.3.7.