[aside]Although the term “impulse response” could technically be used for any instance of sound in the time domain, it is more often used to refer to instances of sound that are generated from a short burst of sound like a gun shot or balloon pop. In Chapter 7, you’ll see how an impulse response can be used to simulate the effect of an acoustical space on a sound.[/aside]
Section 2.2.3 introduces frequency response graphs, showing one taken from Adobe Audition. In fact, there are three interrelated graphs that are often used in sound analysis. Since these are used in this and later chapters, this is a good time to introduce you to these types of graphs. The three types of graphs are impulse response, frequency response, and phase response.
Impulse, frequency, and phase response graphs are simply different ways of storing and graphing the same set of data related to an instance of sound. Each type of graph represents the information in a different mathematical domain. The domains and ranges of the three types of sound graphs are given in Table 2.2.
[table caption=”Table 2.2 Domains and ranges of impulse, frequency, and phase response graphs” width=”80%”]
graph type,domain (x-axis),range (y-axis)
impulse response,time,amplitude of sound at each moment in time
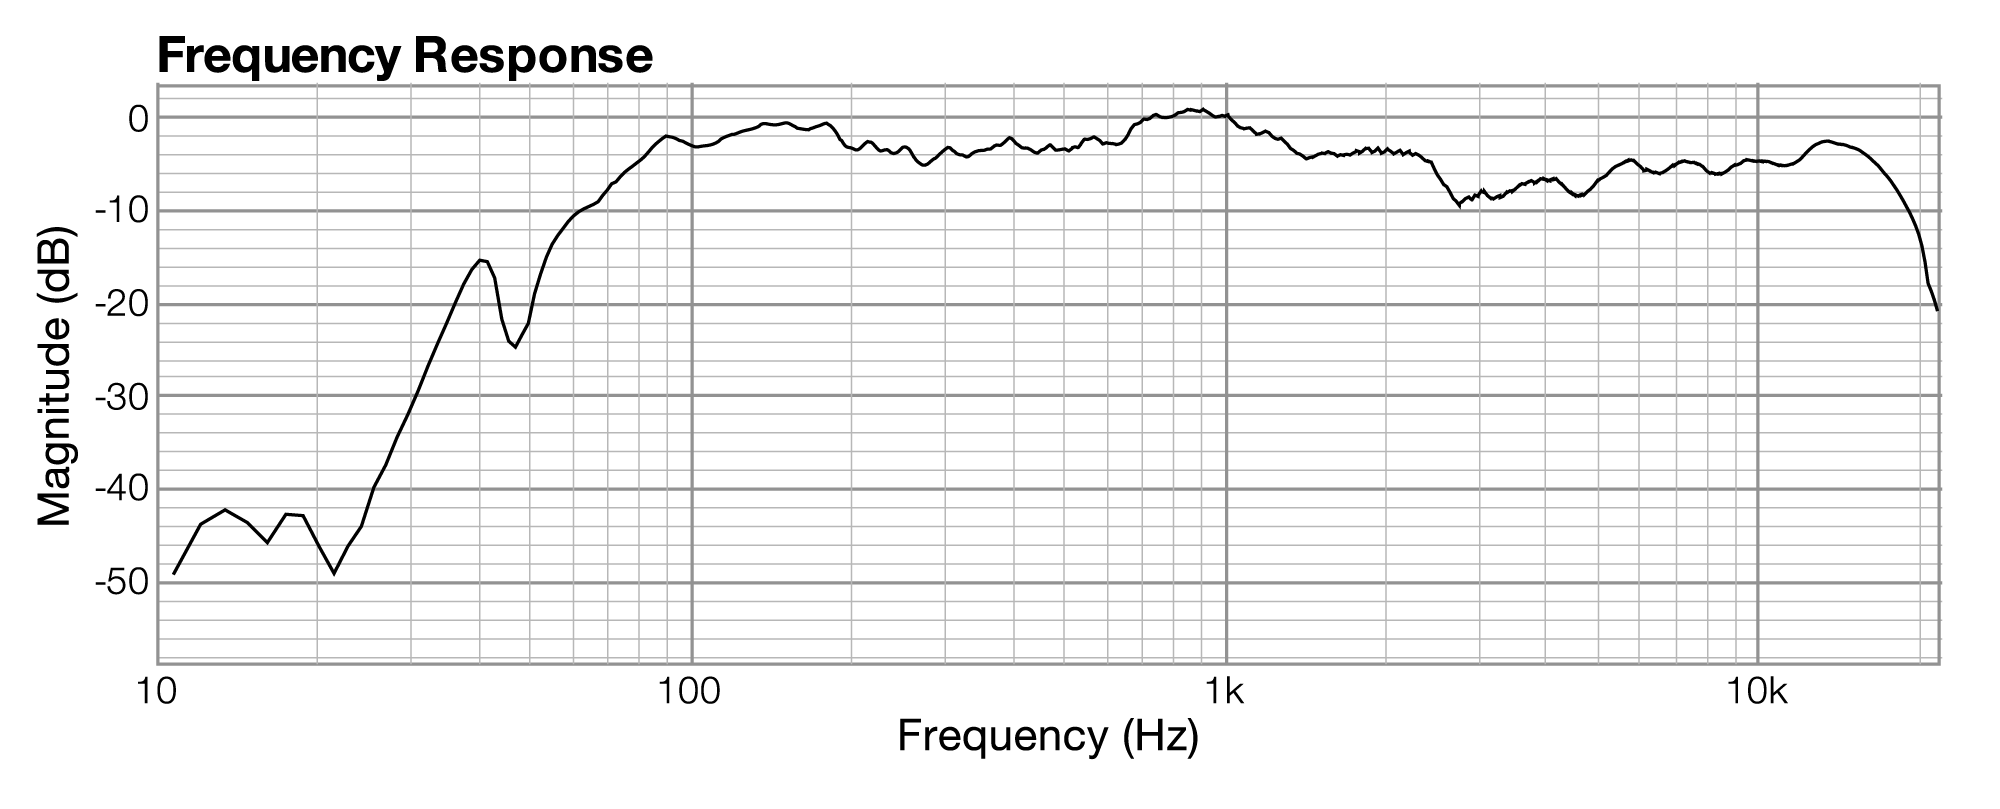
frequency response,frequency,magnitude of frequency across the audible spectrum of sound
phase response,frequency,phase of frequency across the audible spectrum of sound
[/table]
Let’s look at an example of these three graphs, each associated with the same instance of sound. The graphs in the figures below were generated by sound analysis software called Fuzzmeasure Pro.
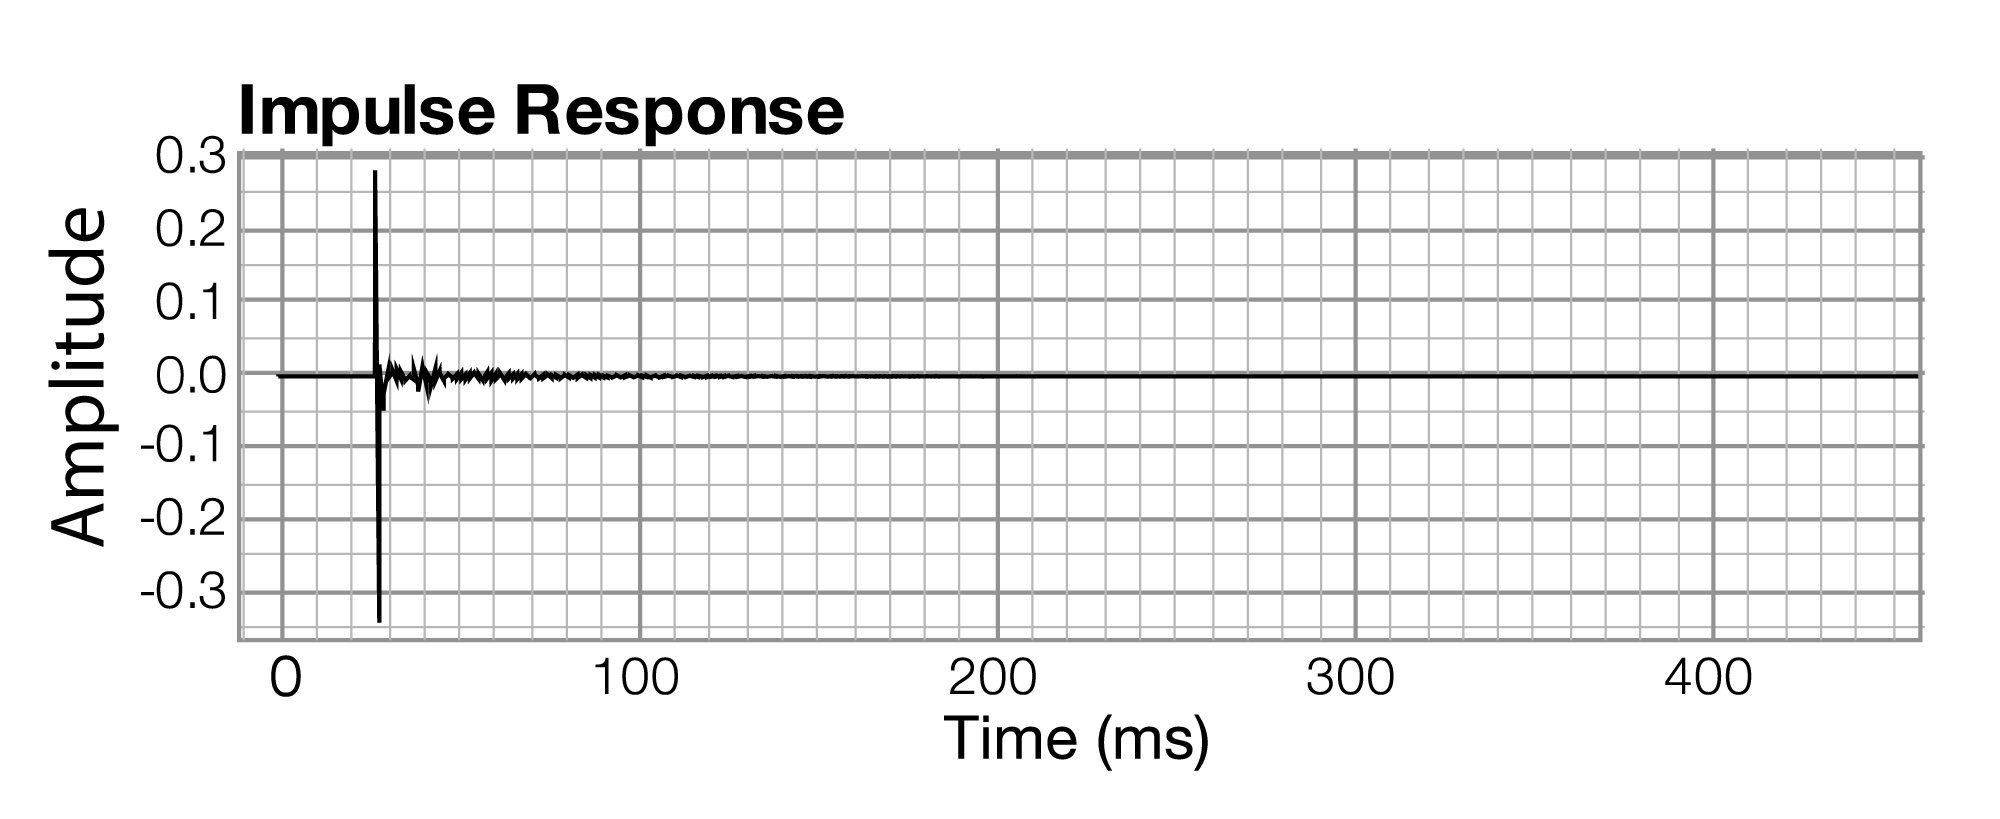

The impulse response graph shows the amplitude of the sound wave over time. The data used to draw this graph are produced by a microphone (and associated digitization hardware and software), which samples the amplitude of sound at evenly-spaced intervals of time. The details of this sound sampling process are discussed in Chapter 5. For now, all you need to understand is that when sound is captured and put into a form that can be handled by a computer, it is nothing more than a list of numbers, each number representing the amplitude of sound at a moment in time.
Related to each impulse response graph are two other graphs – a frequency response graph that shows “how much” of each frequency is present in the instance of sound, and a phase response graph that shows the phase that each frequency component is in. Each of these two graphs covers the audible spectrum. In Section 3, you’ll be introduced to the mathematical process – the Fourier transform – that converts sound data from the time domain to the frequency and phase domain. Applying a Fourier transform to impulse response data – i.e., amplitude represented in the time domain – yields both frequency and phase information from which you can generate a frequency response graph and a phase response graph. The frequency response graph has the magnitude of the frequency on the y-axis on whatever scale is chosen for the graph. The phase response graph has phases ranging from -180° to 180° on the y-axis.
The main points to understand are these:
- A graph is a visualization of data.
- For any given instance of sound, you can analyze the data in terms of time, frequency, or phase, and you can graph the corresponding data.
- These different ways of representing sound – as amplitude of sound over time or as frequency and phase over the audible spectrum – contain essentially the same information.
- The Fourier transform can be used to transform the sound data from one domain of representation to another. The Fourier transform is the basis for processes applied at the user-level in sound measuring and editing software.
- When you work with sound, you look at it and edit it in whatever domain of representation is most appropriate for your purposes at the time. You’ll see this later in examples concerning frequency analysis of live performance spaces, room modes, precedence effect, and so forth.